On this page · 9 sections
Summary. India's three largest quick commerce operators ran 4,081 dark stores between them in March 2026, split as Blinkit 1,954, Zepto 1,089 and Swiggy Instamart 1,038, with Blinkit holding roughly 47.9% of the national count and tracking toward 3,000 stores by March 2027 on JP Morgan's estimate. Redseer put the sector's gross order value at about ₹64,000 crore, roughly US$7.6 billion, in FY2025 and expects the channel to pass US$25 billion in gross merchandise value by 2030. Market sizing for 2026 itself varies widely by methodology: Mordor Intelligence values the India market at US$3.65 billion in 2026 growing to US$6.64 billion by 2031, while an April 2026 industry report projects US$12.97 billion by 2029. The spread is not sloppiness, it is scope, and understanding which definition a number uses is the first discipline this category demands. The second is harder. A 10-minute promise is an inventory-accuracy problem, a routing problem and a forecasting problem, and the customer-facing app is the smallest part of it.
Most teams building in this category start with the app. That is the wrong order.
Why the numbers disagree, and which one to plan against
Before any architecture decision, settle on a definition, because three respectable sources will give you three different market sizes.
| Source | Figure | Period | What it appears to count |
|---|---|---|---|
| Redseer | About ₹64,000 crore (US$7.6 billion) gross order value | FY2025 | Gross order value across the quick commerce channel |
| Redseer | More than US$25 billion gross merchandise value | By 2030 | Channel-level GMV projection |
| Mordor Intelligence | US$3.65 billion, rising to US$6.64 billion by 2031 at 12.74% CAGR | 2026 to 2031 | Narrower market-revenue definition |
| Industry report, April 2026 | US$12.97 billion | By 2029 | Market including JioMart and BigBasket scaling entry |
| Quick Commerce Map 2026 | 4,081 operational dark stores | March 2026 | Blinkit, Zepto and Instamart physical footprint |
Gross order value, gross merchandise value and market revenue are three different quantities, and a report that mixes them will overstate a business case by several multiples. For an investor deck, cite gross order value and say so. For unit economics, none of these numbers matter: what matters is orders per store per day, average order value, and cost to serve.
The dark store count is the most reliable operating signal in the table, because it is a physical, countable thing. It also tells you the real competitive picture: this is a density race, and density is what makes a 10-minute promise physically possible.
The five systems that actually make 10 minutes work
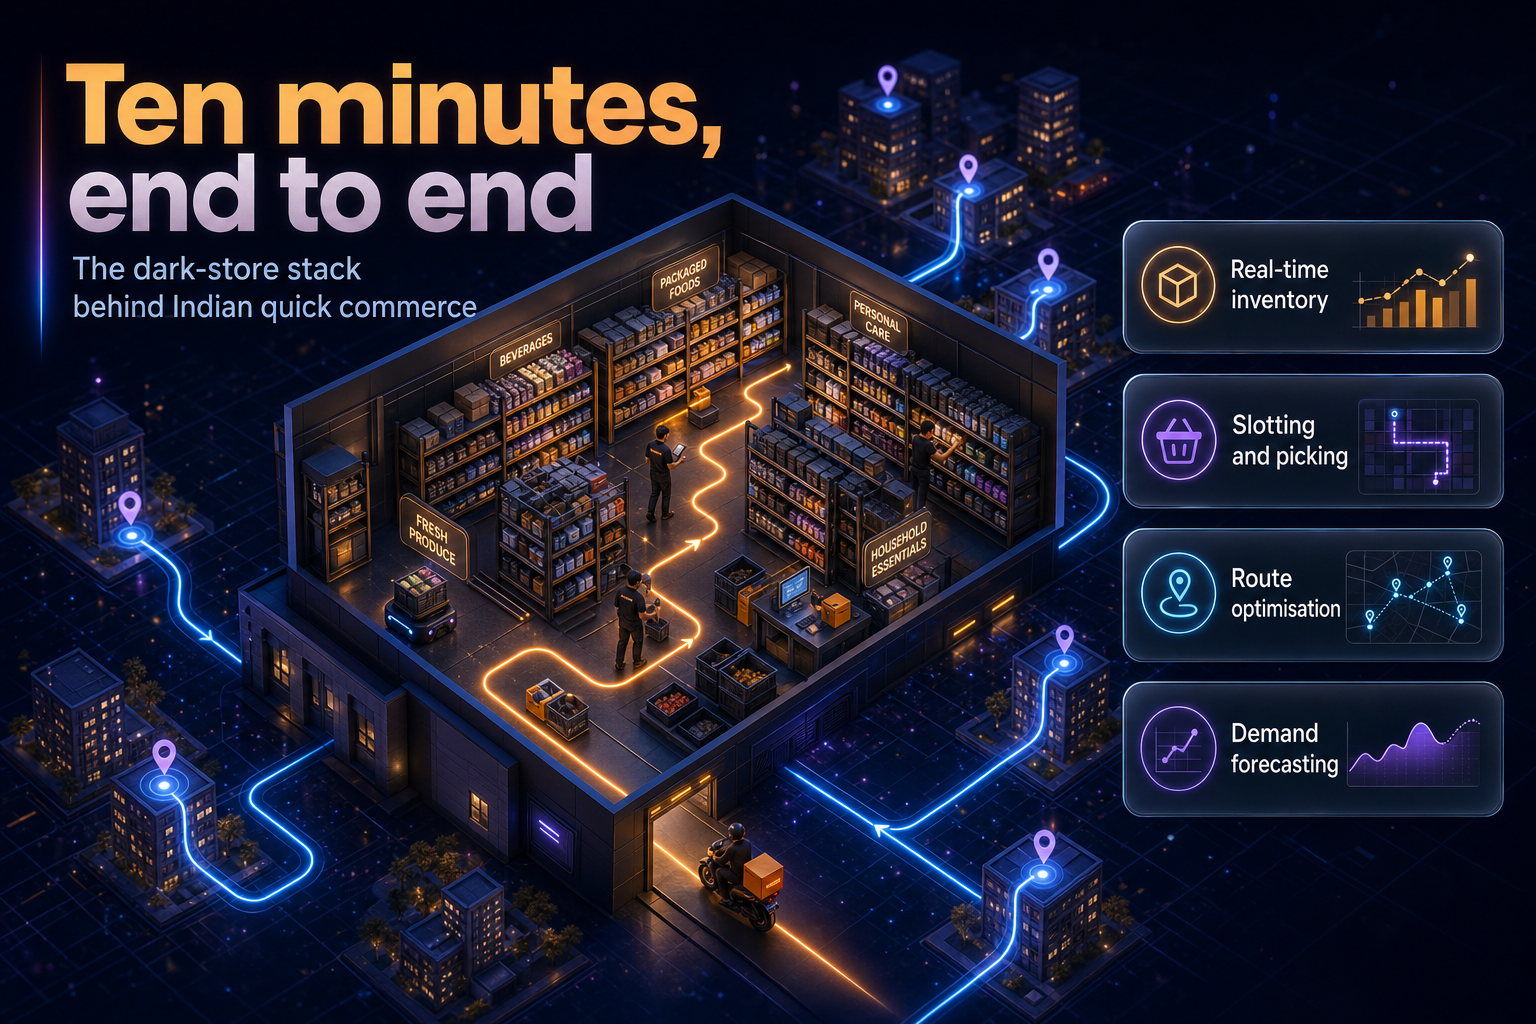
A quick commerce order has a hard real-time budget. The customer taps, and within roughly half a second the system has to know what is genuinely in stock at the store that serves that pin code, commit to a delivery time, and reserve the goods. Everything downstream is execution.
1. Inventory truth, not inventory records
The single highest-value system in quick commerce is the one that knows what is on the shelf right now. Not what the ERP thinks, not what last night's cycle count said. A catalogue that shows an item the picker cannot find produces a cancelled order, a refund, a support contact and a churned customer, and it does all four at the worst possible moment.
Design implications that follow from that:
- Availability is computed per store, per pin code, not nationally. The same SKU is in stock and out of stock at the same instant three kilometres apart.
- Inventory must be reserved at the moment of order acceptance, not at picking. A soft reservation with a short expiry is the standard pattern; without it, two customers buy the last unit.
- Reconciliation runs continuously against picker exceptions. Every "not found" event is a data point that should suppress the SKU immediately and trigger a count, rather than waiting for a nightly job.
- Substitution logic belongs in the order flow, not in a support conversation after the fact.
A store carrying a few thousand SKUs in a couple of thousand square feet has a small enough state space that this is tractable. That is precisely why the format exists.
2. the ETA promise
The delivery estimate is a commitment, and in a category built on a time claim it is also the product. Estimating it well is a prediction problem, with inputs including distance, current traffic, time of day, weather, store load and rider availability. Estimating it honestly is a business decision: a promise you miss costs more than a slightly longer promise you keep.
The engineering trap here is optimising mean error. Customers do not experience the mean. They experience the tail, so the target should be a high-percentile guarantee, and the model should be evaluated on how often it overruns rather than on average accuracy.
3. Picking and store layout
Inside the store, the throughput constraint is the picker's walking path. Slotting decisions, which SKU sits where, are made against demand data and co-purchase patterns, and the picking system issues an ordered route rather than a shopping list. This is a warehouse execution problem compressed into a retail footprint, and it is the part that teams from a pure ecommerce background consistently underestimate.
4. Routing and rider allocation
Assignment is continuous, not per-order. The system decides which rider takes which order, whether to batch two orders going to nearby addresses, and when to hold an order thirty seconds because a better rider is about to free up. Batching improves cost per order and hurts delivery time, and the trade-off between them is a business setting that should be tunable per store and per hour, not hard-coded.
5. Demand forecasting
Forecasting drives replenishment, staffing and slotting. Useful forecasts here are local and short-horizon: what this store will sell in the next few hours, not what the city will sell next month. Rain changes the basket. So does a local holiday, a cricket fixture, or a salary credit date.
Build versus buy, component by component
| Component | Build in-house | Buy or integrate | Why |
|---|---|---|---|
| Real-time inventory and reservation | Build | Core differentiator, tightly coupled to your store operations | |
| Customer app (Android and iOS) | Build | Owns the conversion funnel and the time promise | |
| Picking and store operations app | Build | Directly sets your throughput ceiling | |
| Maps, geocoding and traffic | Integrate | Nobody should rebuild routing base data | |
| Payments and UPI | Integrate | Regulated, commoditised, well served in India | |
| Rider assignment and batching | Build | Cost per order lives here; off-the-shelf rarely fits a dark-store model | |
| Demand forecasting | Start bought, move in-house | Generic models get you live; your own data beats them within a year | |
| Notifications and messaging | Integrate | Undifferentiated |
The pattern is consistent: build the systems that touch inventory truth and cost per order, integrate everything that is a solved commodity. Teams that invert this ship a beautiful app on top of an inventory layer that lies, and then spend a year rebuilding the foundation under live traffic.
What this costs and how long it takes
Be sceptical of anyone quoting a fixed price for "an app like Blinkit". The customer app is perhaps a quarter of the work. A realistic first phase covers a single city, a small store count, and the five systems above in their simplest honest form, with the forecasting layer deliberately naive at launch.
Sequencing that works:
- Store operations first. Inventory, receiving, picking and exceptions, used by real staff in one store before any customer sees an app. If this layer is wrong, nothing above it can be right.
- Customer app against one store. Real orders, real cancellations, real substitution decisions, with the ETA deliberately conservative.
- Rider allocation. Manual dispatch is acceptable at low volume and teaches you the constraints your algorithm will need.
- Multi-store and routing. Pin code to store mapping, batching, and the first genuine forecasting model.
- Scale economics. Only now does slotting optimisation, dynamic ETA and batching tuning pay for itself.
Cost drivers in India are dominated by team composition rather than headcount: this work needs backend engineers comfortable with real-time state, a data engineer early rather than late, and mobile engineers on both platforms. Our comparison of India versus US app development costs covers the wider rate picture.
India-specific considerations
Payments. UPI dominates and refunds are visible fast, which raises the cost of an inventory error. A failed order in this market is a refund conversation within minutes.
Address quality. Indian addresses are frequently descriptive rather than structured. Geocoding accuracy is a first-class engineering problem, not a maps integration detail, and a rider who cannot find a building destroys a 10-minute promise more reliably than any traffic condition.
Tier 2 and 3 expansion. Category growth is increasingly outside the metros, where store density is lower and delivery radii longer. A model tuned for a 2 km radius in Gurugram does not transfer unchanged, and the ETA model has to be retrained per city rather than per country.
Data protection. Order history, precise location and payment metadata together form a detailed personal profile. Systems should be designed aligned with Digital Personal Data Protection Act 2023 requirements from the first schema, including consent capture, purpose limitation and retention rules for location traces. Retrofitting this into a live order pipeline is painful and expensive.
Category mix. Growth beyond grocery into fashion, electronics and beauty changes the stack: higher average order value, different return behaviour, and catalogue complexity that a grocery-shaped product model handles badly.
Where eCorpIT fits
eCorpIT was founded in 2021 and works from Gurugram, at CMMI Level 5 and MSME certified, with partnerships including AWS, Microsoft and Google. Our teams are senior-led and multi-disciplinary, which matters in this category because the work spans mobile, real-time backend, data engineering and physical operations at the same time.
For quick commerce and hyperlocal retail we typically build the store operations layer and the real-time inventory service first, then the customer applications on Android and iOS, then rider allocation. We deliver in eight to twelve week phases with working software in production at the end of each, because a category this operationally sensitive punishes long integration cycles. Related work is described in our ecommerce app development, logistics and supply chain app development and data platform engineering practices, and teams weighing a cross-platform build should read our Flutter app development and Android and Kotlin pages.
FAQ
How eCorpIT can help
eCorpIT builds quick commerce and hyperlocal retail platforms from the operations layer up: real-time inventory, store and picking applications, customer apps on Android and iOS, and rider allocation. We work in short phases that put working software into production, and we design data handling aligned with Digital Personal Data Protection Act 2023 requirements from the first schema rather than as a later retrofit. If you are scoping a dark-store build or fixing an inventory layer that is already live, talk to our team.
References
- India Quick Commerce Map 2026 — dark store counts for Blinkit, Zepto and Swiggy Instamart as of March 2026.
- Quick-commerce boom reshapes India's packaged food market: Redseer report — Business Standard, Redseer gross order value and 2030 channel projection.
- Quick Commerce Market in India size, share, trends and industry outlook to 2031 — Mordor Intelligence market sizing and CAGR.
- India Quick Commerce Report 2026: market to reach $12.97 billion by 2029 — GlobeNewswire, 20 April 2026, market projection and competitive entry.
- JP Morgan prefers Eternal over Swiggy in Q-commerce; Blinkit on track for 3,000 dark stores by March 2027 — Business Upturn, brokerage estimate of Blinkit store expansion.
- Dark stores explained: how Blinkit and Zepto are building dense networks for quick commerce growth — Storyboard18, dark store network density.
- India's Q-commerce market to grow 40% in 2026 — Apparel Resources, growth rate reporting.
- Dark stores fuelling quick commerce growth in India — Shadowfax, dark store operating model.
- Eternal hits record high on strong Q1 growth in quick commerce segment — Business Standard, Eternal quick commerce performance.
- What is Q-commerce in India? Models, examples and growth — Unicommerce, category models and operating challenges.
- Quick commerce statistics and market size 2026 — DemandSage, global and India category statistics.
- Top quick commerce companies in India 2026 — ClickPost, operator landscape.
Last updated: 21 July 2026.