On this page · 12 sections
- What the report is, and what changed on 3 June 2026
- How to open the report
- What each metric means
- What the report does not show
- How AI clicks are counted, and where to find them
- The new report versus the main Performance report
- How to actually read the report, step by step
- India-specific considerations
- Common mistakes when reading the report
- FAQ
- How eCorpIT can help
- References
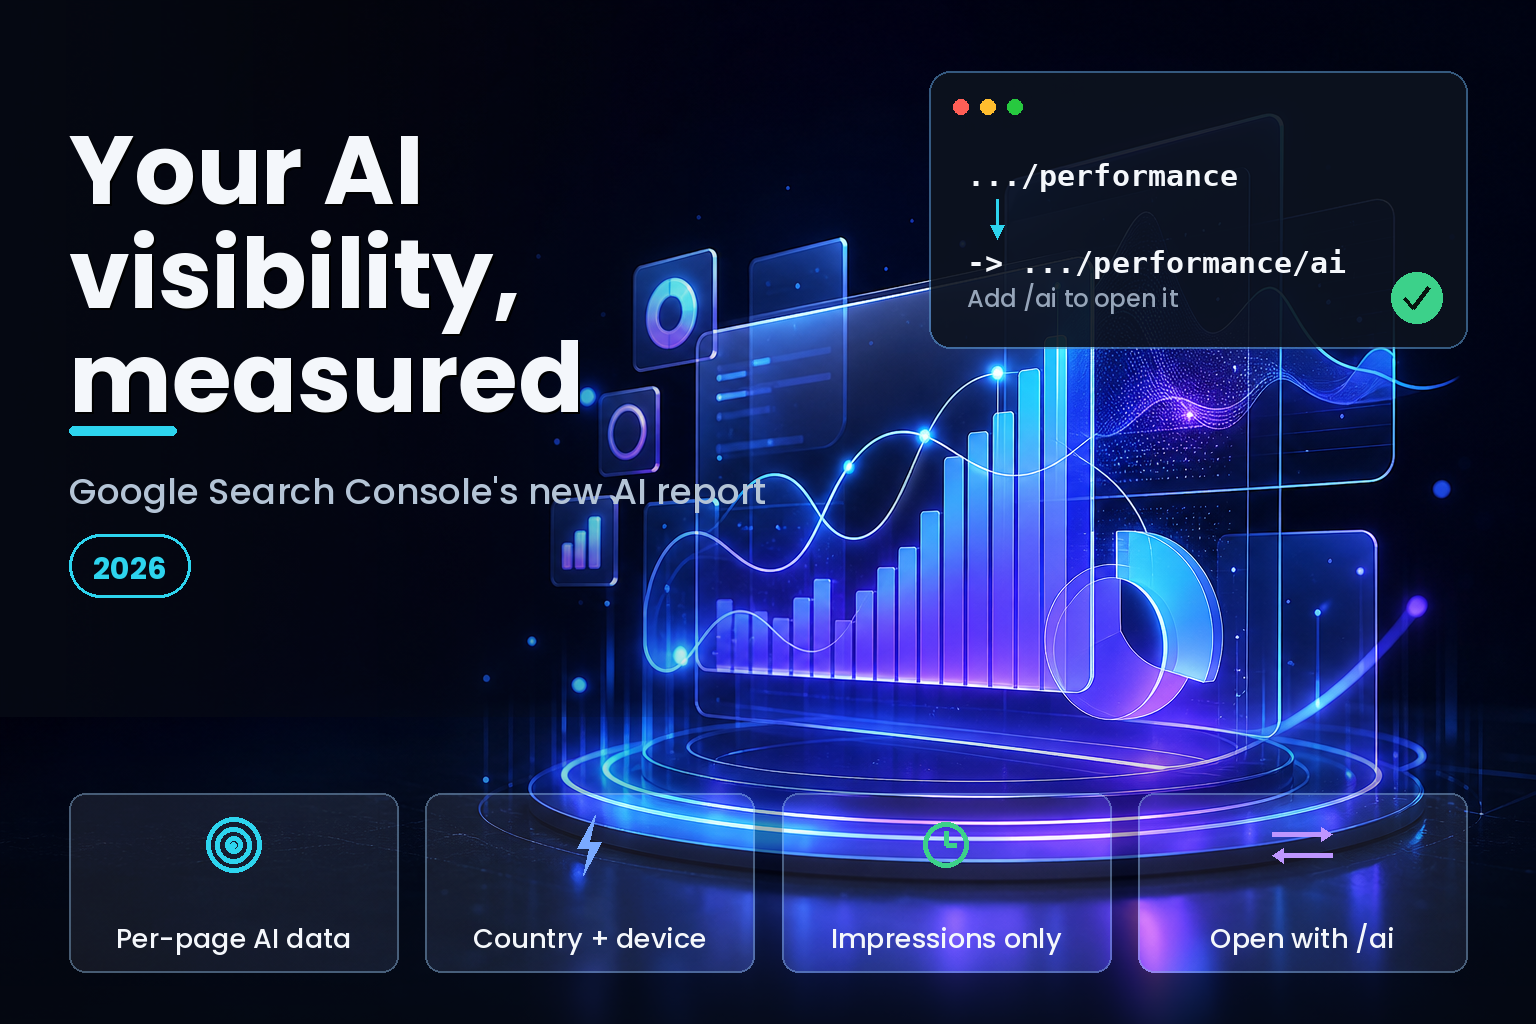
Summary. Google launched the Search Console generative AI performance report on 3 June 2026, and it is the first official view of how your pages show up in AI Overviews, AI Mode, and the generative features in Discover. The report is impressions-first: it gives you five dimensions, impressions, pages, countries, devices, and dates, with granularity from hourly to monthly, but it does not show clicks, click-through rate, position, or query data in this version. You open it by adding /ai to your existing Search and Discover performance report URLs, and the matching blocking controls sit under Settings and Search generative AI. Access is rolling out to a subset of owners who clear a threshold of AI impressions, starting with properties in the UK, and there is no historical backfill, so your baseline begins the day you get access. For teams paying Indian GEO and AEO retainers of 75,000 to 350,000 rupees a month, or $1,500 to $25,000 globally, this report is the free measurement layer those engagements have been missing. This guide shows how to open it, read each dimension, and work around what it still hides.
The report answers a question SEO teams have asked since AI Overviews launched: am I actually showing up in the AI answers, and on which pages? Until now the honest answer was a guess stitched from third-party tools. Google's own data changes that, with real limits worth understanding before you build a dashboard on it.
What the report is, and what changed on 3 June 2026
The generative AI performance report is a dedicated view inside Search Console for Google's generative surfaces. Google's Search Central announcement on 3 June 2026 introduced separate reports for Search and Discover, and confirmed the coverage: AI Overviews and AI Mode within Search, plus generative AI features in Discover. Before this, appearances in AI Overviews were folded silently into your ordinary Performance report totals, with no way to separate them. The new report pulls those generative appearances into their own view.
One framing from Google matters for expectations. The company described the launch as a starting point, saying it is "continuing to work with website owners to understand what insights and data would be most helpful," with additional metrics possible over time. Read the current report as version one, not the finished product.
How to open the report
There are two ways in, and both are quick.
The direct route is the URL. Take your existing Search Console performance report link and append /ai to it, and the same works for the Discover performance report. That loads the generative AI view for the property you are in. The settings route is under Settings, then Search generative AI, which is also where the controls to block your content from AI Overviews and AI Mode live. Our guide to the AI Overviews opt-out and control settings covers that blocking side in detail.
Two access caveats will trip up teams expecting instant data. First, the report is rolling out gradually, beginning with a subset of properties in the UK, and you need to clear a threshold of AI-related impressions before it appears at all, so a low-traffic site may not see it yet. Second, there is no historical backfill. The data starts accumulating from the moment you gain access, so the earlier you get in, the longer the trend you will eventually have.
What each metric means
The report gives five dimensions. None of them is clicks, which is the headline limitation covered below, but each is useful on its own.
| Dimension | What it tells you | How to use it |
|---|---|---|
| Impressions | How often your URLs appeared in generative AI features | Track whether your AI visibility is rising or falling |
| Pages | Which specific URLs surfaced inside AI features | See which content Google trusts enough to cite |
| Countries | Your AI visibility broken down by country | Spot where you are cited and where you are absent |
| Devices | The device type users were on, for Search results | Check mobile versus desktop AI exposure |
| Dates | Performance over time, hourly to monthly | Tie visibility changes to launches and updates |
The pages dimension is the one to watch first. It tells you exactly which URLs Google is pulling into AI answers, which is the closest thing to a citation list you have from the source itself. If a page you optimised for an answer starts surfacing, that is signal your structure and content are working; if a strategic page never appears, that is a content gap to fix.
What the report does not show
Be clear-eyed about the gaps, because they shape what you can and cannot conclude.
The report is impressions-only. There are no clicks, no click-through rate, no average position, and no query-level data in this version. You can see that a page appeared in an AI feature and how often, but not how many people clicked through to you, nor what they searched to trigger it. That makes it a visibility report, not a traffic report.
There is also a coverage gap worth knowing. The Search Console controls and reporting cover AI Overviews and AI Mode in Search, but they do not extend to the Gemini app. A publisher who blocks their content from AI Overviews can still find it summarised inside Gemini, and none of that activity appears here. So the report measures Google Search's generative surfaces, not every place a large language model might use your content. On the question of whether special files change any of this, our analysis of whether llms.txt helps SEO explains why Google ignores those files regardless.
How AI clicks are counted, and where to find them
Because the new report hides clicks, you need to know where click data does exist. In your ordinary Performance report, appearances and clicks from AI Overviews and AI Mode are still counted, but aggregated with regular web search, with no filter to isolate them. Google's counting rules are specific. A click is recorded when a user clicks a link in an AI Overview or AI Mode that sends them to your site; interactions that stay inside Google do not count. An impression is counted when your link is scrolled or expanded into view, and for citations hidden behind a "Show more" control, the impression fires only when the user expands it. An AI Overview occupies a single position, and every link inside it is assigned that same position. When the same URL appears both in an AI Overview and in the blue links for one query, Search Console counts it as a single impression, not two.
The practical consequence: to approximate AI-driven clicks today, pair the new report's impression trend with landing-page traffic in analytics. If a page's AI impressions climb while its organic clicks hold or fall, you are likely seeing the zero-click effect, where the AI answer satisfies users without a visit. For the deeper measurement problem here, our note on ranking versus AI Overview citation data walks through the trade-offs.
The new report versus the main Performance report
These are two different tools, and using the wrong one for a question wastes time. The generative AI report answers "where do I appear in AI features," per URL, in isolation. The main Performance report answers "what traffic did I get," including AI clicks, but blended with regular web search and impossible to filter to the AI surfaces alone. You need both, for different jobs.
| Question | Generative AI report (/ai) | Main Performance report |
|---|---|---|
| Does a specific page appear in AI Overviews? | Yes, listed per URL | No, appearances are aggregated |
| How many AI-feature impressions? | Yes, isolated to AI surfaces | Mixed into web search totals |
| How many clicks from AI answers? | Not shown | Counted, but not isolatable |
| Which query triggered the appearance? | Not shown | Available for web search overall |
| Country and device breakdown | Yes | Yes |
| History before you got access | None, no backfill | Full historical data |
The workflow that follows from this table is simple. Use the generative AI report to build and track your list of AI-cited pages and to watch impression trends by country and device. Use the main Performance report for the click and query context the AI report omits, accepting that its AI numbers are folded into the web-search totals. Neither report alone tells the whole story, and treating either as complete is the most common analytical error teams make with this data.
How to actually read the report, step by step
Turn the data into a routine rather than a one-off look.
- Confirm access by adding /ai to your Search performance report URL. If it loads, you are in; if not, you have not cleared the impressions threshold or the rollout yet.
- Set the date range to the maximum available and note the start date, since there is no backfill and that date is your baseline.
- Open the pages dimension first and list the URLs that surface in AI features. These are your confirmed AI-cited pages.
- Compare that list to your priority pages. Gaps are your content roadmap; unexpected winners show what Google rewards.
- Segment by country and device to see where your AI visibility concentrates, and whether it matches your target market.
- Cross-reference impression trends with landing-page clicks in your analytics tool to estimate the click and zero-click picture the report omits.
- Annotate spikes and drops against your publishing and update calendar, so the trend line becomes explainable rather than mysterious.
Run that loop monthly, and the report becomes a feedback signal on your AI search strategy instead of a vanity chart. Our AI Overview content strategy guide covers the content changes those gaps usually call for.
India-specific considerations
For teams buying SEO and GEO services in India, this report changes the accountability conversation. GEO and AEO retainers run from 75,000 to 125,000 rupees a month at the entry level, 150,000 to 250,000 for a dedicated squad, and up to 350,000 for the top tier, against $1,500 to $25,000 for comparable global agencies. Until now, a vendor could claim AI visibility improvements with little to verify them. The pages and impressions dimensions give you a Google-sourced check: ask which of your URLs now surface in AI features, and whether that list grew during the engagement.
Two cautions apply locally. First, the rollout began in the UK, so Indian properties may see access later; do not treat its absence as a problem with your site. Second, the country dimension is where India-focused businesses learn whether their AI visibility actually lands in India or leaks to other markets, which matters when your buyers are domestic. Keep exposed content free of anything sensitive under the Digital Personal Data Protection Act 2023, since pages that surface in AI features are, by definition, public.
Common mistakes when reading the report
A handful of misreadings recur, and each leads to a wrong decision. The first is treating impressions as traffic. An impression means your URL appeared in an AI feature, not that anyone visited, so an impression rise with flat clicks is often the zero-click effect, not a win to celebrate. The second is misreading a low or missing number as lost visibility, when the real cause is the gradual rollout and the AI-impressions threshold; a property outside the initial UK cohort simply has no data yet. The third is forgetting the Gemini gap: the report covers Search and Discover, so content summarised inside the Gemini app is invisible here and your true AI footprint is larger than the chart.
Two more are subtle. Building a month-over-month dashboard fails early because there is no historical backfill, so your first comparison window is short by design. And attributing every organic click decline solely to AI Overviews ignores the ordinary causes, seasonality, ranking shifts, and core updates, that move clicks independently. Read the report as one input among several, cross-checked against analytics and your own release calendar, and it becomes reliable. Read it in isolation, and it will mislead you in predictable ways.
FAQ
How eCorpIT can help
eCorpIT is a CMMI Level 5, Gurugram-based digital and engineering organisation that builds and measures AI search visibility on real data. We set up the generative AI performance report, baseline your AI-cited pages, and combine its impressions with analytics to reconstruct the click and zero-click picture Google leaves out, then turn the content gaps it reveals into a roadmap. If you want an honest read on where you appear in AI answers, talk to our team and we will build the measurement and the plan around it.
References
_Last updated: 7 July 2026._