On this page · 11 sections
- What AWS announced
- The alert-log boundary, which is the whole story
- "Enabled by default" against a dashboard documented as off
- What "no additional charge" excludes
- The S3 path has three configuration traps
- How to actually find shadowed rules
- India-specific considerations
- What is still unknown
- FAQ
- How eCorpIT can help
- References
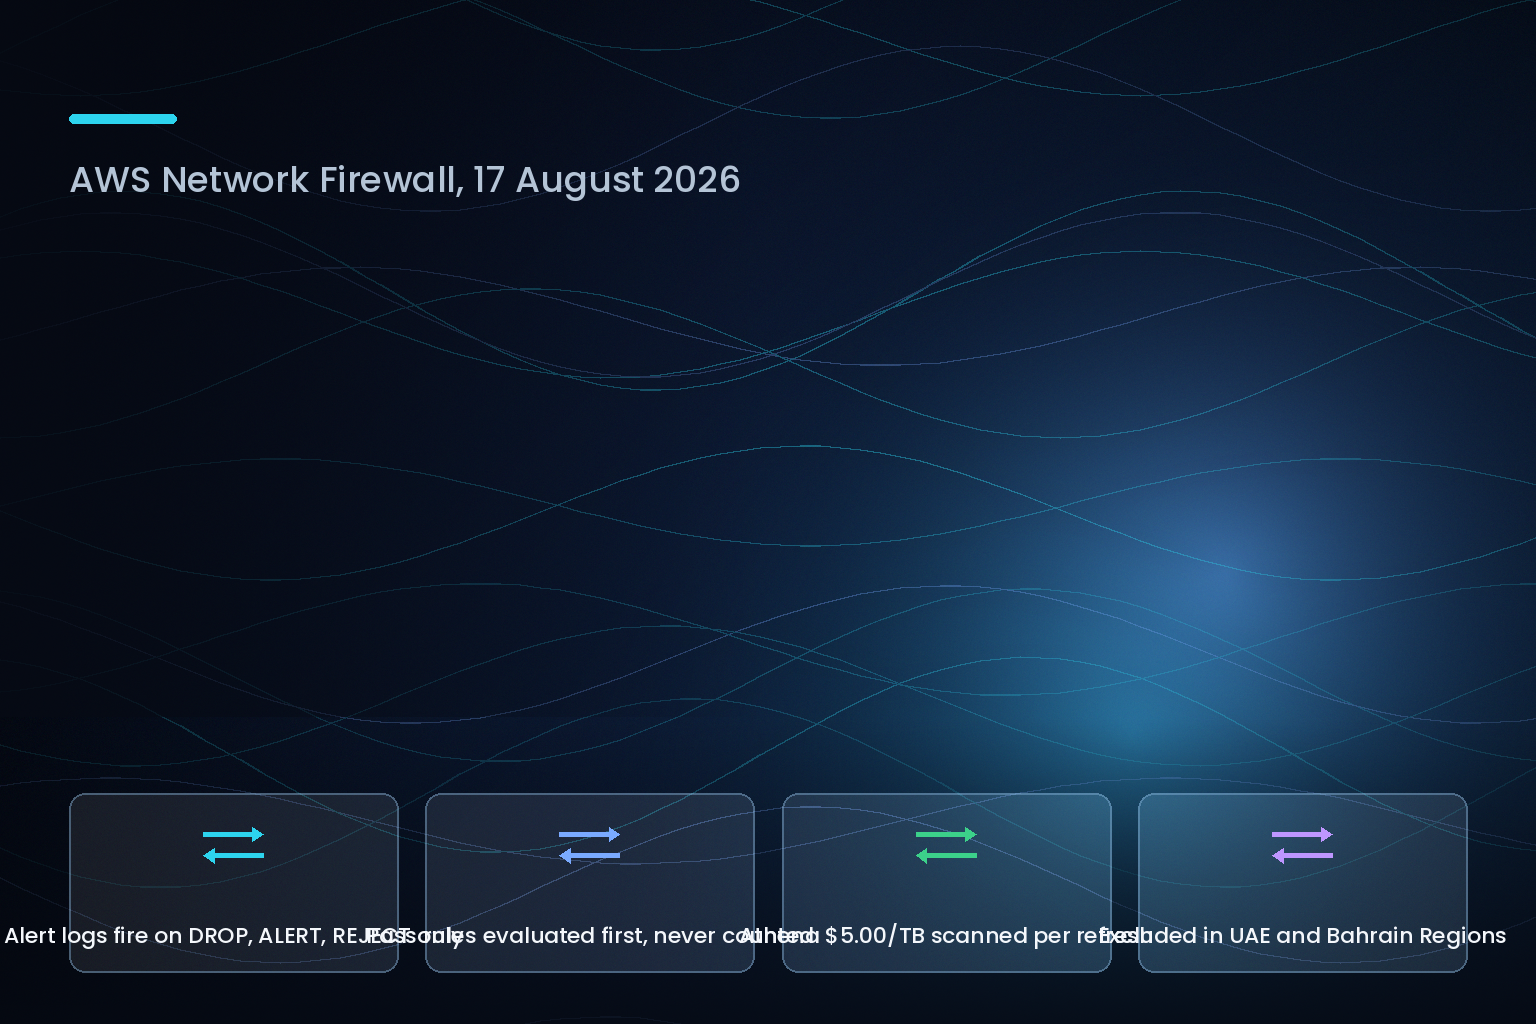
Summary. AWS announced stateful rule hit counts for AWS Network Firewall on 17 August 2026, saying they let you "identify policy blind spots such as shadow, redundant, and obsolete rules" and that they are "enabled by default across both custom and managed rule groups" at "no additional charge." Three parts of that need qualifying against the AWS Network Firewall Developer Guide as it stands on 22 August 2026. The only documented hit-count visualization, "Top Rule Group Hits", is an alert-log metric, and the logging page states that a stateful rule sends alerts only for the DROP, ALERT and REJECT actions. Suricata's fourth action, pass, produces no alert log and is evaluated before all three of the others, so the rule class most likely to shadow your policy is the one class the counter cannot count. The dashboard that carries the visualization is documented as off by default. And every refresh of that dashboard runs a query you pay for: Amazon Athena bills $5.00 per TB scanned and CloudWatch Logs Insights bills $0.005 per GB scanned in US East (N. Virginia), $0.0067 per GB in Asia Pacific (Mumbai). The feature is also excluded in Middle East (UAE) and Middle East (Bahrain).
What AWS announced
The What's New entry, dated 17 August 2026, describes rule hit counts for stateful rules, "giving network administrators and security engineers visibility into how often each stateful rule in the firewall policy matches network traffic." Three claims from that post frame everything below:
- You can "identify policy blind spots such as shadow, redundant, and obsolete rules."
- "Rule hit counts are enabled by default across both custom and managed rule groups, with metrics refreshing at configurable intervals as low as 5 minutes."
- "This capability is available at no additional charge as part of AWS Network Firewall. Standard charges apply for storing and querying log data."
The feature is excluded in Middle East (UAE) and Middle East (Bahrain), and available everywhere else Network Firewall runs.
As of 22 August 2026 the Network Firewall Developer Guide has no page dedicated to rule hit counts in its table of contents, and the document history page carries no entry for the feature. Its most recent entry is the no-source-preservation proxy mode, dated 3 August 2026. So the only documentation you can reason from is the existing monitoring and logging chapters, and those chapters set narrower boundaries than the announcement does.
The alert-log boundary, which is the whole story
The dashboard metrics page lists exactly one hit-count visualization: "Top Rule Group Hits — Most frequently triggered stateful rules by rule group or policy and signature." Its log type column reads Alert logs.
Now read the logging page: "Alert logs report traffic that matches your stateful rules that have an action that sends an alert. A stateful rule sends alerts for the rule actions DROP, ALERT, and REJECT."
Network Firewall supports four Suricata stateful rule actions. The fourth is pass, described in the rule action page as "Discontinue all inspection of the packet and permit it to go to its intended destination." A pass rule is not in the list of actions that send an alert. It therefore generates no alert-log entry, and a metric built on alert logs has nothing to count.
That would be a footnote if pass rules were rare or harmless. They are neither. The same page states the default evaluation order: "By default, the engine processes rules in the order of pass action, drop action, reject action, and then finally alert action." Pass rules go first. An over-broad pass rule is precisely the construct that silently shadows every drop and reject rule underneath it, and it is invisible to the counter AWS introduced to find shadowed rules.
| Suricata stateful action | Evaluation order (default) | Writes an alert log? | Countable in Top Rule Group Hits |
|---|---|---|---|
pass |
First | No | No |
drop |
Second | Yes | Yes |
reject |
Third | Yes | Yes |
alert |
Fourth | Yes | Yes |
The pricing page for logging says the same thing from the cost side, without meaning to: "flow logging sends logs for all of the network traffic that reaches your firewall's stateful rules, but alert logging sends logs only for network traffic that your stateful rules drop or explicitly alert on."
So the accurate scope of the launch is narrower than "find shadow, redundant, and obsolete rules." It is: find which of your dropping, rejecting and alerting rules are firing, and how often. That is genuinely useful for incident response and for confirming a newly deployed drop rule is matching. It does not find the pass rule that made half your policy dead code.
"Enabled by default" against a dashboard documented as off
The announcement says hit counts are "enabled by default across both custom and managed rule groups." The monitoring and reporting page has a column headed "Enabled by default?" and against the firewall monitoring dashboard, which is where Top Rule Group Hits lives, it reads: "No. Must be enabled in your firewall's advanced settings."
Both can be literally true. The counting may be on by default while the surface that shows it is not. But an engineer who reads the announcement and goes looking at the Monitoring tab will find nothing until they turn on detailed monitoring in the firewall's advanced settings, either during firewall creation, from the Edit Logging Configuration page, or from the Monitoring tab directly. There is a further prerequisite the announcement does not mention: you must have alert or flow log delivery configured to CloudWatch Logs or Amazon S3 first, because the dashboard queries those destinations. No log destination means no visualization, whatever the counters are doing internally.
The "configurable intervals as low as 5 minutes" phrasing also has no counterpart in the guide. What the guide documents is on-demand querying: the dashboard queries your logging destinations when you adjust the time range or scope selectors, and when you start a new browser session and open Monitoring from firewall details. Refreshing the browser window, or navigating away and back, clears the displayed data and requires new queries to restore the view.
What "no additional charge" excludes
The feature adds nothing to the Network Firewall line item, and Network Firewall's own rates are unchanged. From the AWS Price List API for offer AWSNetworkFirewall, US East (N. Virginia), read on 22 August 2026: $0.395 per endpoint hour, $0.158 per secondary endpoint hour, $0.065 per GB processed, $0.065 per GB processed through a Transit Gateway attachment, $0.380 per advanced inspection endpoint hour, and $0.005 per GB for advanced threat protection traffic.
The cost of using hit counts sits entirely in the logs and the queries. The guide's own best-practices section is direct about it: "Avoid incurring extra charges by limiting the amount of times you update page data. When the dashboard updates page data, Network Firewall queries your configured logging destinations to pull the latest metrics. Each query incurs an additional charge." It adds that if your firewall sends logs to both CloudWatch and Amazon S3, any update to the dashboard results in separate queries against both. And: "Changes to the time range will affect query costs. The scope selector (10/50/100 results) does not affect the cost of queries."
The rates, all read on 22 August 2026:
| Line item | US East (N. Virginia) | Asia Pacific (Mumbai) |
|---|---|---|
| CloudWatch vended logs ingestion, first 10 TB per month | $0.50 per GB | $0.67 per GB |
| CloudWatch vended logs, next 20 TB | $0.25 per GB | $0.335 per GB |
| CloudWatch vended logs, over 50 TB | $0.05 per GB | $0.067 per GB |
| Infrequent Access vended logs, first 10 TB | $0.25 per GB | $0.335 per GB |
| CloudWatch Logs Insights, data scanned by query | $0.005 per GB | $0.0067 per GB |
| CloudWatch stored data | $0.03 per GB-month | $0.03 per GB-month |
| Amazon Athena, data scanned | $5.00 per TB | Per Region rate applies |
Work an example. A firewall writing 2 TB of alert logs a month to CloudWatch pays $1,024 for ingestion at the first-tier rate in US East (N. Virginia) and $1,372 in Mumbai. If an engineer opens the Monitoring tab and adjusts the time range ten times in a day over a 30-day window that spans that 2 TB, each of those adjustments scans up to 2,048 GB at $0.005, which is $10.24 per query. Ten a day for a working month is roughly $2,048 in query charges on top of ingestion. Athena's $5.00 per TB scanned lands in a similar place for the S3 path, before the metadata and CSV files Network Firewall writes into your bucket. The feature is free. Looking at it is not.
The S3 path has three configuration traps
If you send logs to Amazon S3 rather than CloudWatch, the guide lists prerequisites that will each break the dashboard silently:
- The S3 bucket must be in the same Region as the firewall, because Amazon Athena does not support cross-Region processing.
- If you specify a bucket prefix, it must not begin with a forward slash. A prefix starting with
/is incompatible with Athena processing and prevents the dashboard from functioning correctly.
- Your account needs permission to query the Athena APIs.
Enabling detailed monitoring on an S3-logging firewall also creates Athena tables in your account, managed by the Network Firewall console, plus Athena metadata files including CSV files written into your bucket. Anyone with strict controls over what a service may create in an account should know that before enabling it. And the guide warns that if you later move or modify the bucket or log group the dashboard queries, the metrics it shows can become inaccurate.
How to actually find shadowed rules
Since the hit counter cannot see pass rules, the pass-rule audit stays a separate job. Three things that do work, all documented:
Use flow logs, not alert logs, when the question is "did this traffic reach the engine and get permitted." Flow logging covers all traffic reaching the stateful rules, so permitted traffic appears there even though no alert log exists for the pass rule that permitted it. It costs more to ingest, which is why the guide contrasts the two.
Use strict evaluation order rather than the default action order for policies where shadowing matters, so rule precedence is something you set explicitly with priorities instead of something the default pass-first ordering decides for you.
Use the stateless rule group analyzer for the stateless side of the policy. It is a separate documented tool and it does not help with Suricata rules, but stateless shadowing is a real and separate problem.
Then use the hit-count visualization within its documented scope, which is how often your dropping, rejecting and alerting rules matched traffic. Refresh it deliberately rather than leaving it open on a wall display, because the guide states each refresh runs a billable query.
India-specific considerations
Mumbai (ap-south-1) pays a 34% premium on CloudWatch vended log ingestion at the first tier, $0.67 per GB against $0.50, and 34% more on Logs Insights queries, $0.0067 per GB against $0.005. Stored data is the same $0.03 per GB-month in both. For an Indian team logging alerts at any volume, the dashboard-query habit is the line that moves, not the storage. Teams with a data-residency requirement under the Digital Personal Data Protection Act 2023 should also note the same-Region constraint on the S3 path, which in this case works in their favour: Athena cannot process cross-Region, so the logs stay where the firewall is.
What is still unknown
Whether hit counts exist anywhere outside the alert-log dashboard is undocumented. There is no CloudWatch metric for per-rule hits listed in the Network Firewall metrics page, no API shape published for reading counts programmatically, and no entry in the document history to point at. The "configurable intervals as low as 5 minutes" mechanism has no documented control surface. Until AWS publishes a page for the feature, the safe assumption is the one the guide supports: this is an alert-log visualization in the console, subject to every alert-log limitation.
FAQ
How eCorpIT can help
We run multicloud security posture and CSPM work and DevOps and platform engineering for teams whose firewall policy has grown past the point where anyone can hold it in their head. A pass-rule audit is a specific, bounded piece of work, and it is not something the new hit counter will do for you. Talk to us through /contact-us/.
Related reading: our analysis of AWS Security Agent budget controls and the 20-hour floor, the AWS Security Hub and Azure multicloud CSPM decision guide, and the pillar on cutting cloud spend for Indian teams.
References
- AWS Network Firewall Now Supports Stateful Rule Hit Counts — AWS What's New, 17 August 2026.
- Flow and alert log metrics in the firewall monitoring dashboard — the Top Rule Group Hits entry and its alert-log source.
- Logging network traffic from AWS Network Firewall — alert logs fire on DROP, ALERT and REJECT.
- Defining rule actions in AWS Network Firewall — pass, drop, reject, alert and the default evaluation order.
- Monitoring and reporting in Network Firewall — the "Enabled by default?" table.
- Firewall monitoring in the Network Firewall console — prerequisites and the Amazon S3 constraints.
- Working with the firewall monitoring dashboard — per-query charging and refresh behaviour.
- Pricing for AWS Network Firewall logging — flow versus alert logging volume.
- Document history for AWS Network Firewall — most recent entry dated 3 August 2026.
- Managing evaluation order for Suricata compatible rules — strict versus default action ordering.
- AWS Network Firewall pricing — cross-checked against the AWS Price List API offer
AWSNetworkFirewallfor US East (N. Virginia) on 22 August 2026.
- Amazon CloudWatch pricing — vended logs, Logs Insights and stored data rates, cross-checked against the published CloudWatch metered unit map on 22 August 2026.
- Amazon Athena pricing — cross-checked against the AWS Price List API offer
AmazonAthenafor US East (N. Virginia) on 22 August 2026.
Last updated: 22 August 2026.