On this page · 11 sections
- What actually shipped
- The price exists in one sentence, in one place
- Retention is the gap that will bite hardest
- The command line cannot express the rule the docs recommend
- Hard limits that silently drop data
- India-specific considerations
- What to do this week
- What is still unknown
- FAQ
- How eCorpIT can help
- References
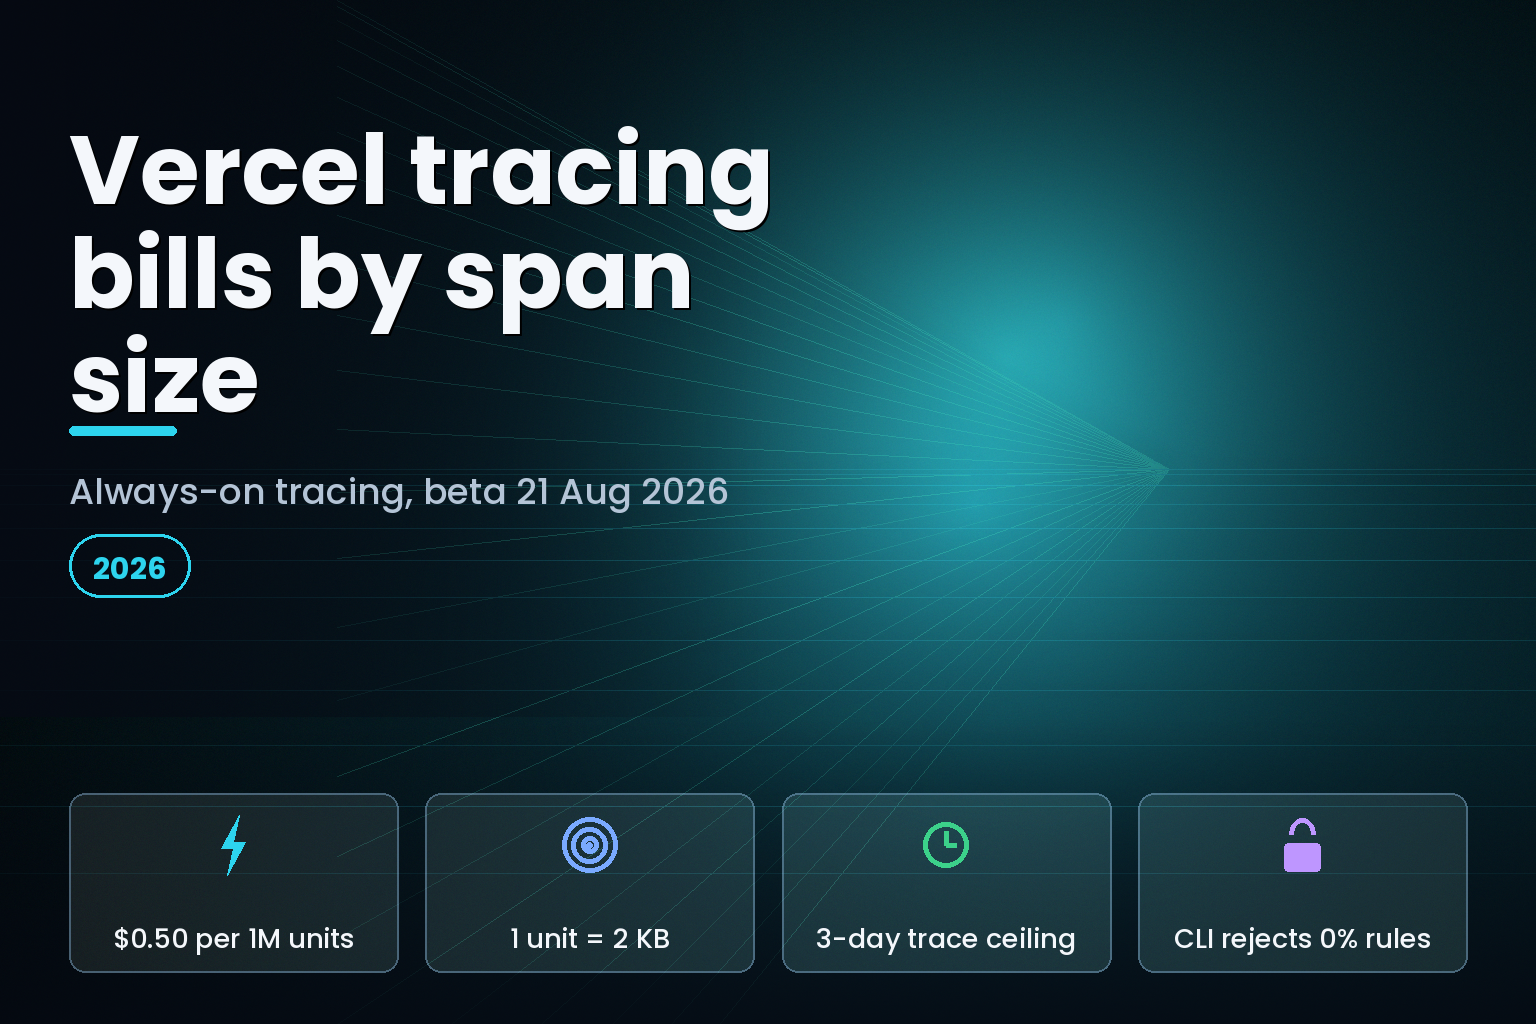
Summary. Vercel put always-on tracing into beta on 21 August 2026 for teams on every plan, priced at $0.50 per 1 million span units. A span unit is not a span: an indexed span up to 2 KB counts as one unit, and every further 2 KB adds another, so a 5 KB span bills as three. That price appears in exactly one place, the changelog post. Vercel's own pricing reference at /docs/pricing, last updated 29 July 2026, contains zero occurrences of the words "span" or "tracing". The feature's documentation page carries a last_updated value of 20 October 2018. Retention is the second gap: the changelog says traces "follow your runtime log retention: 1 hour on Hobby, 1 day on Pro and 3 days on Enterprise", but the runtime logs reference dated 3 August 2026 also lists 30 days of logs for both Pro and Enterprise teams on Observability Plus. Traces get no such row. If you pay for Observability Plus, your logs outlive your traces by 27 days.
What actually shipped
Always-on tracing samples live production and preview traffic and stores the traces so an engineer can open a real request afterwards without reproducing it. Vercel's earlier option, session tracing, only captured requests from the toolbar in your own browser. The tracing overview states the mechanism plainly: "Sampling applies to a whole trace at once, not to individual spans. For each trace, Vercel makes one keep-or-drop decision and applies it to every span, so you never see a partial trace."
Collection is off until you add at least one sampling rule with a rate above 0%. Infrastructure spans and outbound fetch spans are captured automatically. Framework and custom spans require the @vercel/otel package, whose latest release on the npm registry is 2.1.3, published 11 June 2026 under the MIT licence, with a peer range of >=1.9.0 <2.0.0 on @opentelemetry/api. Next.js 13.4 and later contribute route and rendering spans once that package is installed.
| Capability | Always-on tracing | Session tracing |
|---|---|---|
| Traffic covered | Sampled production and preview requests | Requests from one browser session |
| Turned on by | A sampling rule with a rate above 0% | The Vercel toolbar on a deployment |
| Billing model | $0.50 per 1M span units, 2 KB per unit | 1 million spans per month, per team |
| Retention ceiling | 3 days, on Enterprise | Follows the logs view it appears in |
| Plan availability | All plans, beta, 21 August 2026 | All plans, same 1M cap on every tier |
The price exists in one sentence, in one place
The changelog post reads: "Always-on tracing is is now in beta and available to teams on all plans. Tracing is priced at $0.50 per 1M span units." The duplicated "is" is Vercel's, not ours.
The documentation section that should carry that number does not. Always-on Tracing has a heading called "Usage and pricing", and under it defines the unit without ever naming a rate: "During Beta, always-on tracing usage is measured in span units for spans indexed after sampling. An indexed span up to 2 KB counts as one span unit."
We fetched the Markdown source of Vercel's pricing reference on 24 August 2026. Its frontmatter reports last_updated: 2026-07-29, three weeks before launch, and the string "span" does not occur in the document. Neither does "tracing". The same is true of Manage and Optimize Observability, dated 6 July 2026, which is the page a finance owner would read to understand how observability usage turns into a bill.
The billing consequence is not theoretical. Because a span unit is 2 KB of indexed span rather than one span, cost tracks attribute size. A fetch span carrying a long URL, request headers and a response body preview can bill several times over a bare infrastructure span in the same trace. Nothing in the dashboard sampling form exposes span size, so the only lever you get before the invoice is the sampling rate.
Retention is the gap that will bite hardest
Here the two Vercel pages disagree in a way that matters to anyone already paying for observability.
| Plan | Runtime log retention | Always-on trace retention |
|---|---|---|
| Hobby | 1 hour | 1 hour |
| Pro | 1 day | 1 day |
| Pro with Observability Plus | 30 days | Not listed above 1 day |
| Enterprise | 3 days | 3 days |
| Enterprise with Observability Plus | 30 days | Not listed above 3 days |
The runtime logs page, last_updated: 2026-08-03, gives 30 days for both Observability Plus tiers and adds that you can view up to 14 consecutive days of runtime logs inside that 30-day window. The always-on tracing page gives a three-row table with no Observability Plus entry at all. So the changelog's "traces follow your runtime log retention" holds only for teams that have not bought the add-on. For everyone who has, a log line will still be there four weeks after an incident and its trace will not.
Treat 3 days as the real ceiling. If your incident review happens on Monday for a Friday-night fault, the trace is already gone on Enterprise. The workaround Vercel supports is Trace Drains, which forward spans to your own store over OTLP/HTTP. Note the protocol restriction: OTLP/gRPC on port 4317 is not supported, only OTLP/HTTP on the /v1/traces path. Vercel stamps vercel.projectId and vercel.deploymentId as resource attributes on everything it sends.
The command line cannot express the rule the docs recommend
This is the part that breaks automation. The `vercel traces` reference, dated 22 June 2026, is unusually candid about it:
"The dashboard Rate field accepts 0, but the CLI accepts whole percentages from 1 to 100 and rejects both 0 and fractions such as 2.5. To add a 0% rule that matches requests and collects nothing, use the dashboard."
Now read what the always-on tracing page tells you to do: "add a rule with a 0% rate before a broader rule to exclude matching requests, such as a 0% rule on /health". The vendor's own recommended pattern for excluding health checks and webhooks from billing cannot be created from the terminal, from CI, or by an agent holding an API token. It is a dashboard click, and it is the click that keeps a high-volume noisy path out of your span-unit count.
Ordering compounds it. Rules are evaluated top to bottom and the first match wins, a project holds at most 10 rules, and vercel traces config set appends to the bottom of the list. The CLI reference spells out the result: "The CLI cannot reorder rules, so to change the order, remove the rules with rm and add them back in the order you want." A broad rule added in week one silently outranks the precise rule you add in week four.
One more default worth checking before you enable anything: with no rules configured, always-on tracing collects nothing, while a Trace Drain forwards every trace. The two systems read the same shape of rule and behave in opposite directions when the rule set is empty.
Hard limits that silently drop data
Three caps sit in the shared limitations section and apply to both tracing modes.
| Limit | Value | What happens when you cross it |
|---|---|---|
| Trace data per request | 10 MB compressed | The traced request is capped |
| Span size | 1 MB compressed | Largest attributes are truncated first |
| Span size after truncation | Still above 1 MB compressed | The span is dropped entirely |
| Edge runtime custom spans | Never collected | Absent from every trace, any collection mode |
| Sampling rules per project | 10 | No eleventh rule can be added |
Truncation is at least observable: Vercel adds an <attribute_name>.truncated boolean set to true for each attribute it shortens. A dropped span leaves no such marker. If you instrument a function that attaches large payloads to spans, assert on that .truncated flag in a smoke test rather than trusting the waterfall to look complete.
The Edge runtime exclusion is the one most likely to be discovered during an outage. Custom spans from functions on the Edge runtime do not appear in traces regardless of how they were collected, so an Edge-heavy application gets infrastructure and fetch spans and nothing you wrote yourself.
India-specific considerations
Traces carry request attributes, and request attributes carry personal data more often than teams expect: query strings with email addresses, header values with device identifiers, fetch spans with customer IDs in the path. Under the Digital Personal Data Protection Act 2023, that content is in scope wherever it lands. Vercel's tracing documentation describes retention windows and truncation behaviour but does not state a storage region for collected traces, so an Indian team with a residency position should route spans to storage it controls through a Trace Drain rather than relying on the platform's 1-hour to 3-day window as a deletion control. The same reasoning applies to sampling: a 0% rule on an authenticated path is a data-minimisation measure, and as shown above, it can only be created in the dashboard.
Teams comparing this with a general-purpose vendor should weigh it against Datadog LLM observability pricing caps and against the OpenTelemetry GenAI semantic conventions, which govern how agent spans should be named if you plan to move this data anywhere else later.
What to do this week
Add one rule, not ten. Start at a low rate on production with no path prefix, watch the span-unit line for a full billing week, and only then narrow with path prefixes. Before you raise the rate, create the 0% exclusion rules for /health, webhook receivers and any polling endpoint, and create them in the dashboard first so they sit above the broad rule in evaluation order. Record the rule order somewhere outside Vercel, because the CLI will not restore it for you.
If you already pay for Observability Plus, decide now whether 3 days of traces is enough for your incident process. If it is not, a Trace Drain to your own OTLP/HTTP endpoint is the only supported answer, and it needs to be configured before the incident, not after. Teams running this alongside Vercel custom metrics and observability event billing should model both meters together, since sampling decisions made for tracing do not change metric volume. The same discipline applies to Vercel deployment storage billing and retention defaults: the platform's defaults are chosen for convenience, not for your finance plan.
The real cost here is usually the attribute payload, not the request count.
What is still unknown
Vercel has not published a general availability date, has not said whether the beta price of $0.50 per 1M span units survives GA, and has not stated whether Observability Plus will extend trace retention the way it extends log retention. The pricing reference has not been updated since 29 July 2026. Until it is, the changelog sentence is the only price of record, and a changelog post is not a commitment.
FAQ
How eCorpIT can help
Span-unit billing rewards teams that decide what to instrument before they turn collection on, and punishes the ones that discover attribute size on an invoice. Our senior engineering teams size sampling rules against real traffic, set the exclusion rules that the CLI cannot create, and build the Trace Drain path to storage you control so a three-day retention ceiling never decides how long you have to investigate. We are ISO 27001:2022 certified and CMMI Level 5 appraised, and we design tracing pipelines aligned with DPDP Act 2023 data-minimisation requirements. To review your observability spend and retention plan, talk to our observability engineering team or read how we approach observability cost and OpenTelemetry migration.
References
Last updated: 24 August 2026.