On this page · 11 sections
- What shipped
- The cost model, in numbers you can plan against
- The two caps, and what happens at the boundary
- Three documentation gaps to check before you ship
- How this compares with what you were probably using instead
- The other two things Vercel shipped on 20 August
- India-specific considerations
- What is still unknown
- FAQ
- How eCorpIT can help
- References
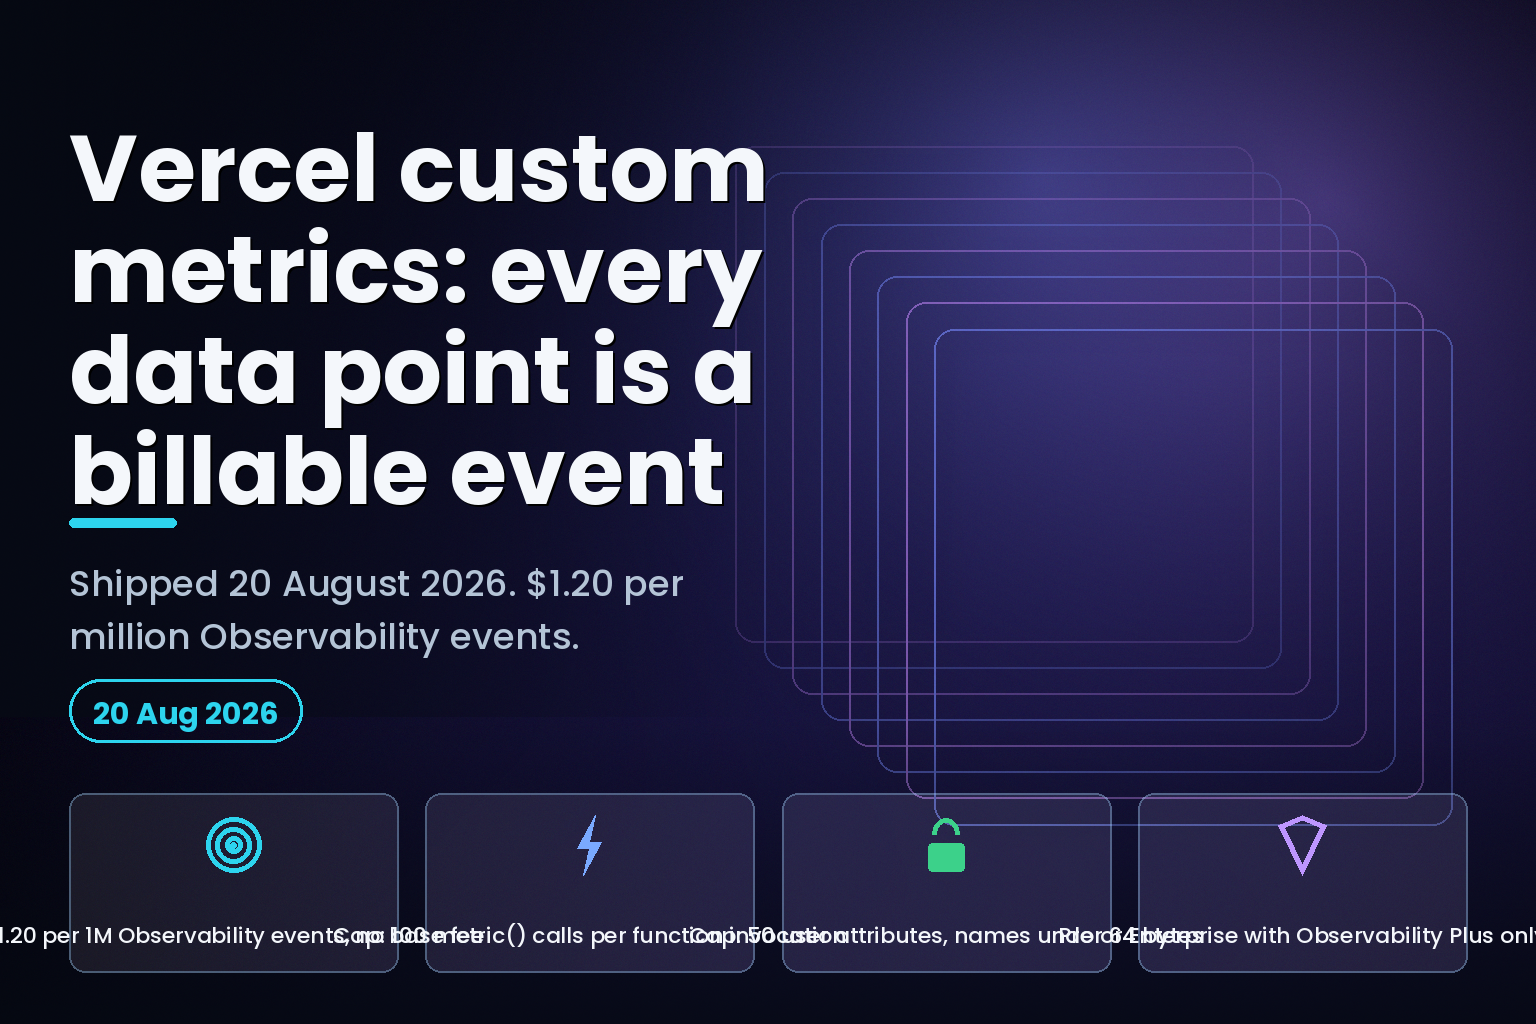
Summary. Vercel shipped custom metrics for Vercel Functions on 20 August 2026 at 17:00 UTC. The billing rule is one line in the docs: "Each custom metric data point counts as one Observability event. Vercel charges $1.20 per 1 million Observability events." There are two hard caps, both stated twice in Vercel's own documentation: 50 user-supplied attributes per emission, and 100 metric() calls per function invocation. A team emitting one metric on each of 1 million invocations pays $1.20 a month. A team emitting the maximum 100 pays $120 for the same traffic. The plan requirement appears only in the changelog — "available on Pro and Enterprise with Observability Plus" — and nowhere on the documentation page a developer would actually read. Two further gaps matter more than the price: custom metrics are absent from the "tracked events" list that every Vercel pricing table links to as the definition of a billable event, and no retention period for custom metrics is published anywhere.
What shipped
The API is a single function from the @vercel/functions package. Vercel's changelog entry gives the whole surface:
            import { metric } from "@vercel/functions";

metric("database.query_ms", 120, {
  table: "my-table",
  db: "my-database"
});
Three parameters, per the reference table: name (string, required), value (number, required, documented as "The numeric value to record (64-bit floating-point)"), and attributes (an optional Record<string, string>). There is no counter, gauge or histogram taxonomy. Vercel's framing is flat: "Each call to metric() records a data point that you can query and chart in Observability."
Once emitted, the changelog lists three consumption surfaces — a query builder, Notebooks for dashboards, and a vc metrics CLI command. Vercel attaches five metadata fields automatically: deploymentId, requestId, functionRegion, pathType and edgeNetworkRegion. The changelog describes this as adding "useful attributes like the source deployment and function region", which understates it — the docs list five, not two, and each one is a dimension you can group by without paying for an attribute slot.
The cost model, in numbers you can plan against
| Emission pattern | Function invocations / month | Billable events | Monthly cost at $1.20 / 1M |
|---|---|---|---|
| 1 metric per invocation | 1,000,000 | 1,000,000 | $1.20 |
| 5 metrics per invocation | 1,000,000 | 5,000,000 | $6.00 |
| 20 metrics per invocation | 1,000,000 | 20,000,000 | $24.00 |
| 100 metrics per invocation (the cap) | 1,000,000 | 100,000,000 | $120.00 |
| 5 metrics per invocation | 50,000,000 | 250,000,000 | $300.00 |
Vercel's own worked example matches the first row: "emitting one custom metric during each of 1 million function invocations records 1 million Observability events." Usage is prorated within the billing cycle, and the pricing page notes Observability Plus "uses usage-based pricing with no base fee."
There is no free allowance. None of the three Vercel pricing pages we checked publishes an included quantity of Observability events. The 50,000-events and 10,000-events figures that show up in Vercel's usage documentation belong to Web Analytics and Speed Insights, which are separately billed at $0.65 per million events. Do not model Observability against them.
At these rates the absolute numbers stay small until traffic scales. The failure mode is not a single large bill; it is instrumentation that gets added inside a hot loop. Emitting inside a per-row handler rather than a per-request handler multiplies the event count by the row count, and nothing in the API signals that you have done it. The 100-per-invocation cap is the only backstop, and it caps the blast radius at 100x, not at something safe.
The two caps, and what happens at the boundary
Both limits are stated identically on the custom-metrics page and in the @vercel/functions package reference:
- Up to 50 user-supplied attributes per emission.
- Up to 100
metric()calls per Vercel Function invocation.
Vercel does not document what happens on the 101st call — whether it throws, drops silently, or truncates. It does document what happens to malformed names: "Metric names, attribute names, and attribute values must be non-empty and shorter than 64 bytes. They can contain ASCII letters (A-Z, a-z), digits (0-9), hyphens (-), shows (_), periods (.), and slashes (/). Unsupported characters are automatically replaced with an show (_). For example, data+summary is stored as data_summary."
That silent substitution is the trap. A metric named checkout+total and a metric named checkout_total become the same series, and no error surfaces. Anyone generating metric names from user input, tenant slugs or feature flags should sanitise before emitting rather than discover the collision in a dashboard.
What Vercel does not publish anywhere we could find: a cap on the number of distinct metric names per project or team, any label-value cardinality limit, and any ingestion rate limit. On a system billed per data point, unbounded cardinality is normally the thing a vendor governs first. Here it is simply unaddressed.
Three documentation gaps to check before you ship
The plan gate is in the changelog only. The changelog states custom metrics are "billed as observability events and available on Pro and Enterprise with Observability Plus." The custom-metrics documentation page contains no plan requirement at all — the strings Pro, Enterprise and Observability Plus do not appear on it. A developer arriving from a search result reads a pricing section that says $1.20 per million events and nothing that says their Hobby team cannot use the feature. Separately, Observability Plus is documented as unavailable during a Pro trial: "Convert to a Paid Pro plan to access it."
Custom metrics are not on the list they are billed against. Every Vercel pricing table renders the billing unit as "$1.20 per 1 million events" with the word events linking to the tracked-events anchor in the Observability docs. That anchor enumerates exactly five items: Edge Requests, Vercel Function Invocations, External API Requests, Routing Middleware Invocations and AI Gateway Requests. Custom metrics are not among them. So the page that defines what a billable event is contradicts the page that says a custom metric data point is one. In practice the custom-metrics page is newer and more specific and is almost certainly correct — but if you are writing a chargeback policy off Vercel's definitions, the definition page has not caught up.
Retention is unstated. The Observability Plus page gives 30 days for Plus data generally and "Hobby: 12 hours, Pro: 1 day, Enterprise: 3 days" for the free tier, and its limitations table has no custom-metrics row. The custom-metrics page never mentions retention. If a metric exists to support a quarterly review, that is a question to answer before the instrumentation ships, not after.
Two more signals worth naming. Custom metrics do not appear in Vercel's own Observability surface inventories — neither the "available insights" table nor the page enumerating every Observability tab lists them, even though the custom-metrics page instructs users to "select the Observability tab, then select Custom Metrics". And the CLI documentation disagrees with itself: the custom-metrics page shows vercel metrics database.duration_ms --filter "plan:pro" and instructs vercel metrics list, while the CLI reference documents an OData filter form, --filter "<dimension> eq '<value>'", and a vercel metrics schema subcommand with no list. One of those pairs is wrong; run the CLI once before writing either into a runbook.
How this compares with what you were probably using instead
| Option | Billing unit | Published rate | Cardinality governance |
|---|---|---|---|
| Vercel custom metrics | Observability event per data point | $1.20 per 1M events | None published |
| Vercel Speed Insights | Event | $0.65 per 1M events | Not applicable |
| Vercel Observability Plus (built-in) | Event | $1.20 per 1M events | Not applicable |
The comparison that matters is not against another Vercel line item, though. It is against shipping an OpenTelemetry exporter to a metrics backend you already run. Custom metrics win on effort — one import, one function call, no collector to operate — and they lose on portability, because the query language, the retention and the alerting all live inside Vercel. Teams already paying for a metrics platform should treat this as convenience instrumentation for function-local signals, not as a replacement for the backend that holds their SLOs. We cover the trade-off in more depth in our observability cost and OpenTelemetry migration work, and the same day-one-adoption question applies to self-hosting Next.js away from the Vercel adapter.
The other two things Vercel shipped on 20 August
The same changelog day carried "Vercel Agent is now available in Slack code channels", described as available "in public beta for Pro and Enterprise teams", and CLI management for the Vercel Container Registry through new vercel vcr commands, with Docker, Podman and Buildah supported.
The Agent item has a cost question of its own. Vercel Agent pricing states: "Vercel Agent charges the underlying provider inference rate with no markup, plus a Vercel Token Rate of $0.25 per million tokens", and that rate "applies to input, output, and cached tokens." The pricing table has one Slack row and no row for code channels, and the Slack documentation for code channels states no billing terms at all — it points readers back to the same pricing page. So a code-channel session is billed under the Slack row by omission rather than by any Vercel statement. Given that a code channel is explicitly a shared surface where "anyone in the channel can follow the work, give Agent new instructions", the question of who can spend from that budget is worth settling in your own team policy, because Vercel's documentation does not settle it. The only other free allowance Vercel publishes for Agent is 10 investigations per billing cycle with Observability Plus.
India-specific considerations
Billing is in US dollars per event, so the effective rupee cost moves with the exchange rate and there is no India-specific rate card. At $1.20 per million events, five metrics per invocation across 10 million monthly invocations is $60, roughly ₹5,200 a month at recent rates — small enough that it will not appear in a cloud-cost review and large enough to grow unnoticed. Under the Digital Personal Data Protection Act 2023, the practical constraint is what goes into the attributes object: attribute values are strings you choose, and putting an email, a phone number or a customer identifier in one turns a metrics pipeline into personal-data processing on a US-hosted platform. Metric attributes should carry categories, not identities. Where an identifier is genuinely required for debugging, keep it in a request-scoped log with its own retention, not in a metric dimension.
What is still unknown
Vercel has not published a retention period for custom metrics, a cardinality or distinct-name cap, an ingestion rate limit, or the behaviour past 100 emissions per invocation. Two of the pages documenting this feature carry a last_updated value of 20 October 2018, which makes the freshness signal on them unusable. And the CLI filter syntax is documented two incompatible ways.
FAQ
How eCorpIT can help
eCorpIT builds instrumentation and cost-control layers for teams running serverless and edge workloads, including metric taxonomy design that keeps cardinality and personal data out of dimensions. We are CMMI Level 5, MSME Certified and ISO 27001:2022 certified, and we design telemetry pipelines aligned with DPDP Act 2023 requirements. If you are deciding between platform-native metrics and a portable OpenTelemetry pipeline, our API integration and modernisation team can scope both. Reach our senior engineering team at /contact-us/.
References
Last updated: 21 August 2026. All prices, limits and quoted text verified against the primary Vercel pages listed above on that date.