On this page · 10 sections
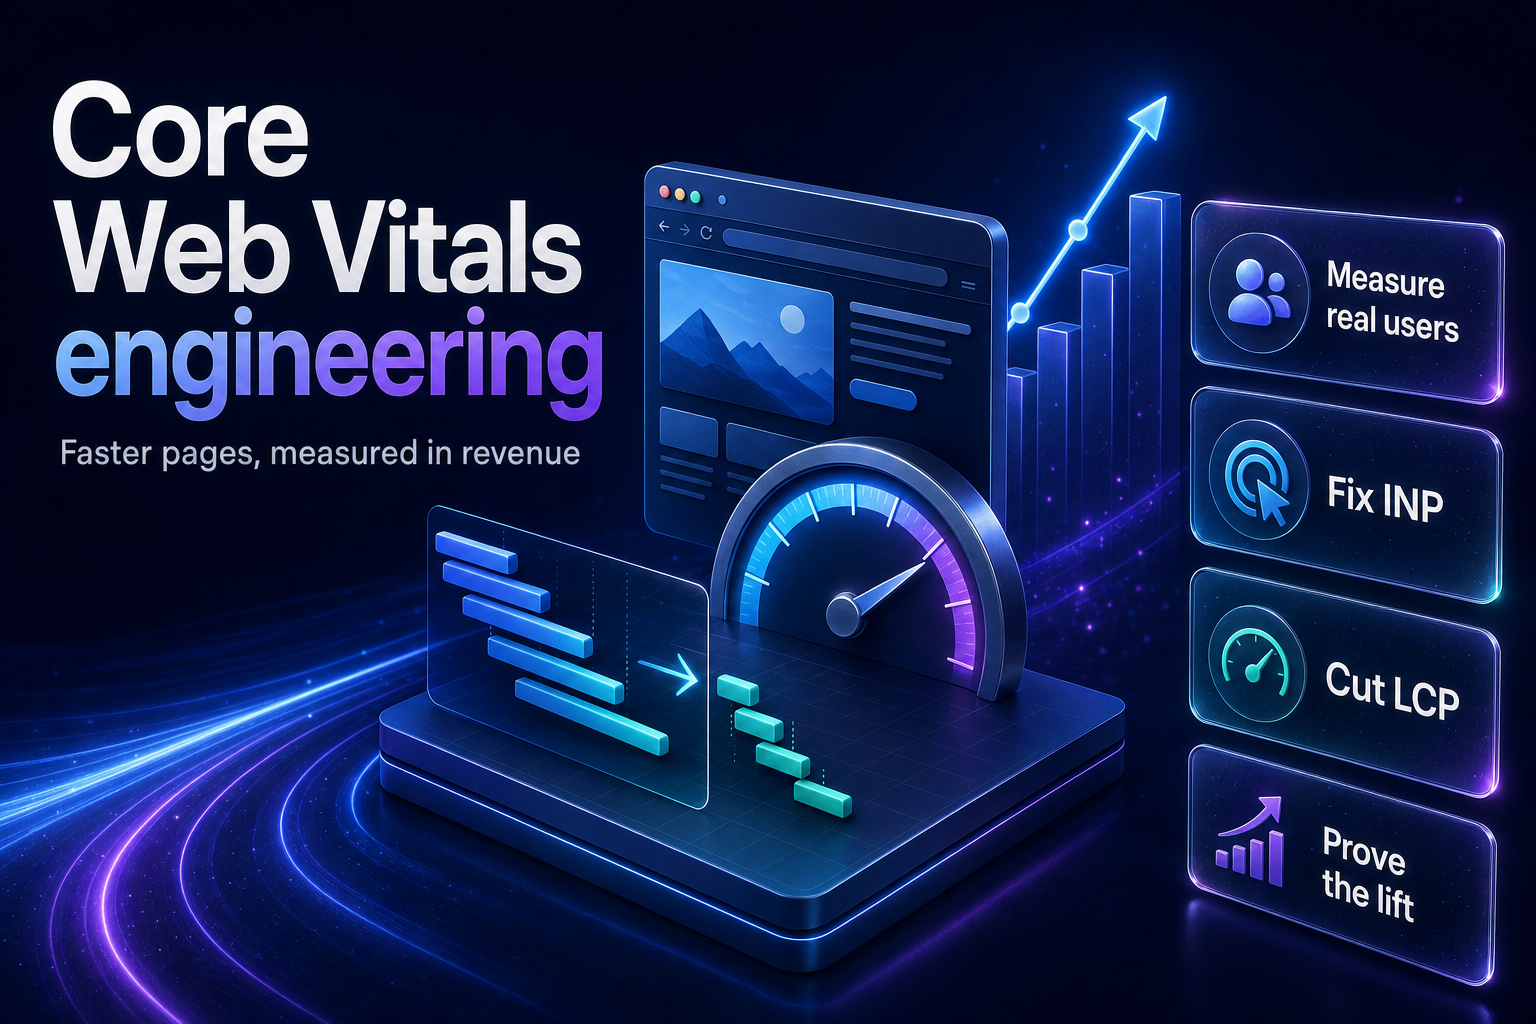
Summary. Google's Interaction to Next Paint threshold is 200 milliseconds for a good score, measured at the 75th percentile of page loads, with anything above 500 milliseconds rated poor. Those numbers have not changed, despite a run of "Core Web Vitals 2026 update" posts claiming otherwise. The clearest proof that the metric is worth engineering against comes from India: redBus, the bus booking site, cut the INP of one page by 72% and reported a 7% overall increase in sales, documented by Google on web.dev. Chrome usage data cited in that same documentation shows 90% of a user's time on a page is spent after it loads, which is exactly the window INP covers and load-time metrics miss. On ₹10 crore of annual online revenue, a 7% lift is ₹70 lakh. This article covers what Google actually measures, the 3 interaction types that count, and the fixes that moved redBus.
Most performance advice sent to Indian ecommerce and SaaS teams is either a Lighthouse screenshot or a list of generic tips. Neither tells you which interaction is costing you money.
This does.
What Google measures, and what it does not
Interaction to Next Paint is a stable Core Web Vital that assesses responsiveness. Google's INP documentation, authored by Jeremy Wagner and Barry Pollard of the Chrome team and last updated on 2 September 2025, sets the bands precisely:
- An INP at or below 200 milliseconds means good responsiveness.
- Above 200 milliseconds and at or below 500 milliseconds needs improvement.
- Above 500 milliseconds is poor.
The threshold is assessed at the 75th percentile of page loads recorded in the field, segmented across mobile and desktop.
The part teams get wrong is what counts as an interaction. Only three types are observed: clicking with a mouse, tapping on a touchscreen, and pressing a key. Scrolling, hovering and zooming are not measured.
That exclusion misleads people into ignoring scroll performance, which is a mistake for a different reason covered below.
INP reports the longest interaction observed, with outliers discarded. Google's documentation is specific about the mechanism: "we ignore one highest interaction for every 50 interactions". Pages with heavy interaction counts therefore get a small amount of protection from a single random hiccup, and pages with few interactions do not.
The Chrome team's stated reason for the metric is the one worth repeating to a sceptical stakeholder: "Chrome usage data shows that 90% of a user's time on a page is spent after it loads". A site can pass Largest Contentful Paint comfortably and still feel broken for nine tenths of the visit.
The 2026 Core Web Vitals update that has not happened
Search for Core Web Vitals right now and you will find a cluster of posts announcing a 2026 update: tightened INP sampling, expanded soft-navigation support, TTFB promoted in PageSpeed Insights. Some of them are specific enough to sound authoritative.
Google's own INP documentation, which carries a changelog link and a last-updated date of 2 September 2025, records none of it. The thresholds it publishes are 200 milliseconds and 500 milliseconds, unchanged.
Treat those posts as unverified until a change appears in the Chromium metrics changelog that Google links from the metric definition, or on web.dev's blog. Rebuilding a performance roadmap around a threshold change that Google has not made is an expensive way to learn this lesson. If you want the same discipline applied to AI search claims, we wrote about that in our guide to ranking without clicks.
What redBus actually changed
redBus is a bus booking and ticketing website based in India. Google published their INP case study on web.dev, written by Amit Kumar and Saurabh Rajpal.
The starting point is familiar. The team expected their INP to be fine. Real User Monitoring data at the 95th percentile said otherwise.
They instrumented with the web-vitals JavaScript library and analysed the results in ELK. Three changes did the work.
First, the scroll handler. The search page lazy-loaded additional fares on scroll. Scrolling is not measured by INP, but the scroll event listener scheduled a large amount of main-thread work, and that contention delayed the interactions that are measured. They debounced the handler and prioritised the resulting render with requestAnimationFrame.
This is the reason to care about scroll performance even though INP ignores scrolling.
Second, the fetch size. Lazy loading pulled 30 results per network call. Cutting that to 10 moved observed INP from a range of 870 to 900 milliseconds down to 350 to 370 milliseconds. They also began fetching the next batch at the second-to-last card rather than the last.
Third, the input fields. A change event on the search page's inputs called an expensive reducer, rerendering the interface on every keystroke. The fix was to keep input state local and sync it to the Redux store only on blur. That single change improved the page's INP by 72%.
The reported business outcome was a 7% overall increase in sales.
| Change | Mechanism | Measured effect |
|---|---|---|
| Debounce scroll handler | Fewer main-thread callbacks during scroll | Main thread free to answer taps |
requestAnimationFrame for render |
Render work lands before next frame | Faster visual feedback |
| Fetch 10 results instead of 30 | Smaller response, less parse and render | INP 870-900 ms to 350-370 ms |
| Prefetch at second-to-last card | Lazy load triggers earlier | Fewer blocking loads mid-scroll |
Local input state, sync on blur |
Reducer runs once, not per keystroke | Page INP improved 72% |
| All of the above | Combined | About 7% increase in sales |
The measurement traps that waste a quarter
Four details in Google's documentation quietly invalidate a lot of performance work. Each one is a reason a team reports success internally while CrUX refuses to move.
Lab tools may report no INP at all. Many only load the page without interacting, so nothing is measured. Google suggests Total Blocking Time as a rough proxy, while stating plainly that it "is not a substitute for INP in and of itself". A green Lighthouse score is not an INP result.
Short interactions are invisible by default. Event entries below 104 milliseconds are not reported by performance observers unless you set durationThreshold, and even then the floor is 16 milliseconds. If you built a custom RUM pipeline and saw suspiciously few events, this is why.
Iframes split the picture. INP as a metric includes interactions inside iframes, because users do not know or care what is in a frame. The JavaScript API cannot see into cross-origin iframes. Google names this directly as a source of divergence between CrUX and your own RUM numbers. Embedded video players, payment frames and chat widgets all land here.
Back/forward cache restores reset the value. When a page is restored from bfcache, its INP resets to zero, because users experience it as a distinct visit.
            // Note the import path: the attribution build, not plain 'web-vitals'.
// The base build reports the value only and leaves attribution undefined.
import {onINP} from 'web-vitals/attribution';

// Report the interaction WITH attribution, not just the final value,
// so you can see WHICH element is slow rather than that something is.
onINP(({value, rating, attribution}) => {
  navigator.sendBeacon('/rum/inp', JSON.stringify({
    value,                                  // ms
    rating,                                 // good | needs-improvement | poor
    target: attribution?.interactionTarget, // the selector that hurt
    type: attribution?.interactionType,     // pointer | keyboard
    inputDelay: attribution?.inputDelay,
    processing: attribution?.processingDuration,
    presentation: attribution?.presentationDelay,
    url: location.pathname,
  }));
}, {reportAllChanges: false});
The attribution fields matter more than the score. An INP of 480 milliseconds tells you that you have a problem. interactionTarget tells you which button.
A sequence that works
INP has three parts: input delay before any handler runs, processing duration while handlers execute, and presentation delay until the frame appears. Fixing the wrong one produces no movement, which is why attribution comes before optimisation.
| Symptom in attribution | Likely cause | First fix |
|---|---|---|
| High input delay | Long tasks blocking the main thread | Break up or defer third-party and hydration scripts |
| High processing duration | Expensive handler, state store thrash | Move state local, sync on blur, memoise reducers |
| High presentation delay | Large DOM, heavy style recalculation | Reduce DOM size, narrow selector scope |
| Poor only on list or filter pages | Per-item rerender on every change | Virtualise the list, debounce the filter |
| Poor only during load | Interaction competing with hydration | Defer non-critical hydration |
Work in that order: measure in the field, attribute to an element, reproduce in the lab, fix, then confirm in the field 28 days later. CrUX reports on a trailing window, so a fix shipped today does not show up tomorrow, and teams that expect it to often ship a second change before the first one has been scored.
The real cost is usually the third-party script you did not write.
India-specific considerations
Device mix is the whole argument. INP is assessed at the 75th percentile across real devices, which in India means a large share of mid-range Android handsets rather than the flagship on the developer's desk. A page that responds in 90 milliseconds on a MacBook can sit in the poor band in the field. This is precisely the gap redBus found between their expectation and their 95th-percentile RUM data.
That makes field measurement non-optional for Indian consumer traffic. A lab-only performance programme will report success while CrUX stays red.
The commercial case follows the same logic. redBus reported about a 7% increase in sales from this work. Applied to ₹10 crore of annual online revenue, a 7% lift is ₹70 lakh, against an engineering effort measured in weeks. That arithmetic is illustrative rather than a promise, since the lift depends on how much responsiveness is currently costing you, which is knowable only from your own field data.
For teams also weighing how performance interacts with AI-driven search surfaces, see our analysis of GEO, AEO and SEO under AI Overviews and our note on agentic browsing and Lighthouse audits.
How we run this work
eCorpIT runs Core Web Vitals engagements in a fixed sequence, and we are specific about it because vague performance retainers are how budgets disappear.
We start with a field-data baseline: web-vitals with attribution wired into your existing analytics or an ELK-style pipeline, plus the CrUX origin and URL-level picture from PageSpeed Insights. That produces a ranked list of interaction targets by cost, not a list of Lighthouse warnings.
We then reproduce the top offenders in the lab, fix them, and re-measure in the field. Deliverables are the instrumentation, the fixes in your repository, and a dashboard your team keeps.
We are an engineering organisation, founded in 2021 and based in Gurugram, assessed at CMMI Level 5 and MSME certified, working with senior-led, multi-disciplinary teams. Our partners include AWS, Microsoft, Google and Shopify, which matters here mostly because Shopify and cloud CDN configuration are where a lot of Indian ecommerce performance is won or lost.
Engagements usually run as a scoped audit first, then an implementation sprint, so you can stop after the audit if the numbers do not justify the work. We say that plainly because on some sites they do not.
Related: our custom web application development work and our QA and test automation service, which is where performance regressions get caught before they ship.
FAQ
How eCorpIT can help
eCorpIT builds and fixes the front-end and API layers that decide these numbers, for ecommerce and SaaS teams in India and abroad. We start with field measurement and attribution so the work targets the interactions actually costing revenue, then implement the fixes in your codebase and leave the instrumentation behind. Our senior engineering teams work from Gurugram across Shopify, custom web applications and cloud delivery. Talk to us about a scoped Core Web Vitals audit before committing to a build.
References
- Interaction to Next Paint (INP) — Jeremy Wagner and Barry Pollard, web.dev, updated 2 September 2025.
- How redBus improved their website's Interaction to Next Paint (INP) and increased sales by 7% — Amit Kumar and Saurabh Rajpal, web.dev.
- Optimize Interaction to Next Paint — web.dev.
- How to optimize INP — web.dev.
- Find slow interactions in the field — web.dev.
- INP metrics changelog — Chromium source.
- web-vitals JavaScript library — GoogleChrome on GitHub.
- Chrome User Experience Report documentation — Chrome for Developers.
- Why does speed matter? — web.dev.
Last updated: 20 July 2026.