On this page · 10 sections
- What changed on June 8, 2026
- Coverage and utilization: two metrics that fail in opposite directions
- What coverage target should you pick?
- How to run a target coverage analysis in the Purchase Analyzer
- A worked example
- Where target coverage still leaves a judgement call
- India-specific considerations
- How eCorpIT can help
- FAQ
- References
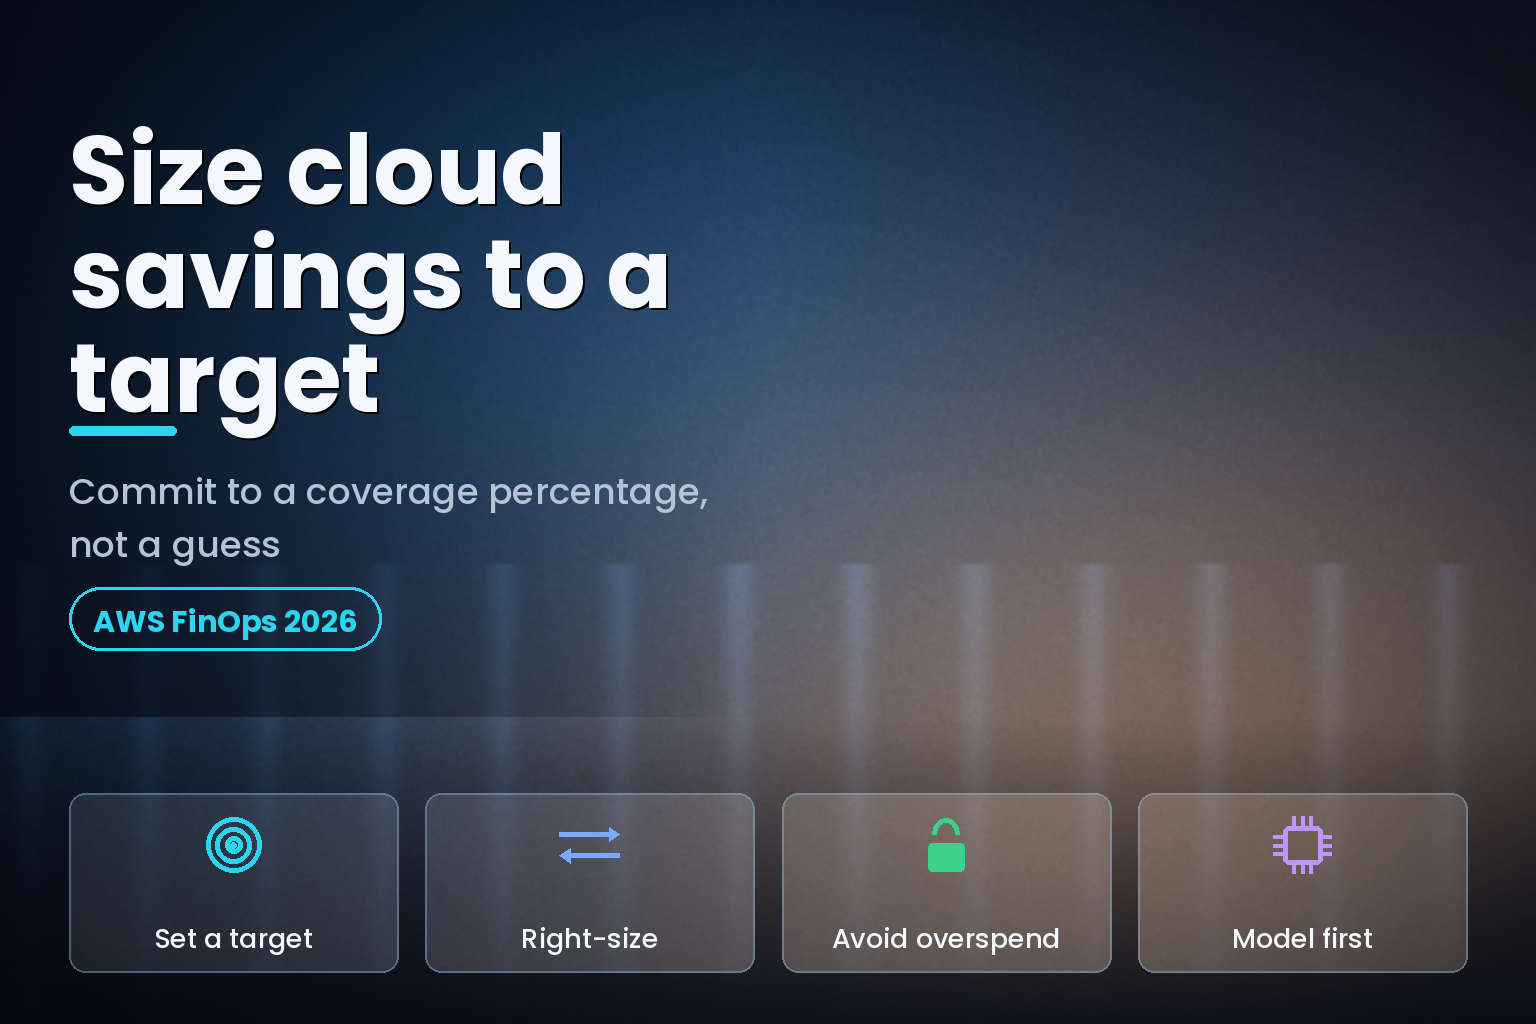
Summary. On June 8, 2026 AWS added target coverage analysis to the Savings Plans Purchase Analyzer, the one control FinOps teams had asked for since the tool shipped in November 2024. You can now name a coverage percentage of your On-Demand spend and get the exact hourly commitment needed to hit it, instead of accepting a recommendation tuned only for savings rate. Compute Savings Plans discount eligible usage by up to 66% and EC2 Instance Savings Plans by up to 72%, so on a $10,000-a-month compute bill the sizing decision is worth thousands of dollars every month. Most teams run 70% to 90% coverage on stable workloads; a common starting point is 70%, rising toward 85% to 90% as the usage floor becomes clear. This guide explains coverage versus utilization, how to pick a target, how to run the analysis over a lookback window of up to 60 days, and where the feature still leaves a judgement call for the engineer.
Getting the number wrong is expensive in both directions. Over-commit and you pay upfront for compute you never consume. Under-commit and eligible usage keeps running at full On-Demand rates. AWS, the FinOps Foundation, and independent practitioners all point at the same root cause: sizing the commitment to the wrong baseline. Target coverage does not remove that judgement, but it turns "how many dollars per hour should I buy?" into "what coverage do I want, and what does that cost?", which is a question a platform team can actually answer.
What changed on June 8, 2026
The Savings Plans Purchase Analyzer launched in November 2024 as a way to model a purchase before you commit. Its weakness was the recommendation logic: it optimised for the maximum savings rate, which often pushed a larger commitment than a cautious team wanted, and it gave no direct way to say "cover 80% of my On-Demand spend and no more."
The June 2026 update, documented on the AWS What's New page for target coverage analysis, closes that gap. You specify a Savings Plans coverage percentage of your On-Demand spend, and the analyzer uses your historical usage to return the hourly commitment needed to reach that level, directly in the AWS Billing and Cost Management console. It shipped alongside two other June 2026 releases in the same FinOps push, the AWS FinOps Agent public preview and AI-powered cost investigations, but target coverage is the one that changes how you size a commitment.
The distinction matters because the old default answer, "buy whatever maximises the savings rate," is the answer that most often leads to a stranded commitment six months later when a workload is refactored, moved to Graviton, or shut down.
Coverage and utilization: two metrics that fail in opposite directions
Before you pick a target, be clear on the two numbers people mix up. They measure different things and they break in different ways.
Utilization answers a question about the commitment you already bought: of the commitment I purchased, how much am I actually consuming? AWS defines Savings Plans utilization as commitment hours used divided by total commitment hours purchased, times 100. A 95% utilization rate means 95 cents of every committed dollar is earning a discount. Low utilization means you bought too much and are wasting the commitment.
Coverage answers a question about your bill as a whole: of my eligible On-Demand spend, how much is covered by a commitment at all? A 40% coverage rate means 60% of your eligible compute is still running at full On-Demand pricing, an unrealised saving. Low coverage means you left money on the table.
The two fail in opposite directions, which is exactly why sizing is hard. Push coverage too high and utilization drops as workloads change. Keep coverage conservative and utilization stays near 100%, but your effective savings rate is low because most of the bill never got the discount. The FinOps Foundation's rate optimization capability frames this as the core tension of commitment-based discounts.
| Metric | Question it answers | Formula (plain) | Fails when | Healthy range |
|---|---|---|---|---|
| Coverage | How much eligible spend gets a discount | Covered eligible spend / total eligible On-Demand spend | Too low: savings left on the table | 70% to 90% on stable usage |
| Utilization | How much of the commitment you use | Commitment hours used / commitment hours purchased | Too low: paying for unused commitment | Aim near 80% or higher steady-state |
| Effective Savings Rate | True blended discount vs On-Demand | Total savings / equivalent On-Demand cost | Hidden by high utilization alone | Higher is better; benchmark per account |
Effective Savings Rate (ESR) is the metric that ties the two together. It measures the true blended discount against what the same usage would have cost at On-Demand rates. ESR was introduced by ProsperOps and later adopted by the FinOps Foundation, and it is the number worth optimising, because a 100% utilization rate on a tiny commitment can still leave your ESR low. Target coverage sizes the input; ESR judges the outcome.
What coverage target should you pick?
There is no universal number, but the practitioner consensus is narrow. The standard benchmark for Savings Plans coverage is around 80%. Most FinOps teams start nearer 70% in the first purchase cycle, then layer up toward 85% to 90% as confidence in the baseline grows. Stable, always-on workloads sit comfortably at 70% to 90%; highly variable or seasonal environments deliberately stay lower to avoid stranded commitment.
The rule that prevents most over-commitment is to size to your stable usage floor, not your average and never your peak. Your floor is the compute that runs every hour of every day, the baseline that will still be there after the next deployment. Commit to that, start at roughly 70% to 80% of it, and layer additional commitment as the floor proves itself. Full 100% coverage is rarely the right call, because it leaves no room for a workload to move, shrink, or be re-architected.
| Workload profile | Suggested starting coverage | Why |
|---|---|---|
| Always-on production baseline | 80% to 90% | Predictable floor, low change risk |
| Steady internal platforms | 70% to 80% | Stable but occasional refactors |
| Batch and data pipelines | 60% to 75% | Usage moves with job schedules |
| Seasonal or campaign-driven | 40% to 60% | Peaks are temporary, floor is thin |
| New or fast-changing services | 0% to 40% | Baseline not yet established |
Term choice compounds the sizing decision. Per the AWS Savings Plans product page, Compute Savings Plans reach up to 66% off and cover EC2, Fargate, and Lambda across any Region and instance family, which is the flexible option. EC2 Instance Savings Plans reach up to 72% off but lock you to one instance family in one Region. The deepest discounts on both require a three-year, all-upfront commitment; shorter terms and no-upfront payment give up some of the discount for flexibility. A conservative coverage target on a flexible one-year Compute plan is usually the safer first commitment than a high target on a rigid three-year plan.
How to run a target coverage analysis in the Purchase Analyzer
The workflow lives in AWS Billing and Cost Management. The steps below follow the AWS documentation for running a purchase analysis and reviewing the results.
- Pull your current coverage first. Open the Savings Plans coverage report, filter to the last 30 days, and note your current average coverage percentage and your average hourly On-Demand spend. This is your baseline to improve on.
- Open the Purchase Analyzer and choose a lookback period. You can select any range within the last 60 days. Pick a window that reflects your future usage, and exclude a range that contains an unusual spike or a decommissioned workload so it does not distort the recommendation.
- Handle expiring commitments. Under exclude expiring Savings Plans, you can drop plans expiring within the next 90 days. If you exclude them, the analyzer treats the account as having no active commitment and recommends the full commitment needed to cover your historical usage, which is useful for planning a clean renewal.
- Set your target coverage. Instead of accepting the savings-maximising recommendation, enter the coverage percentage you decided on above. The analyzer returns the hourly commitment needed to reach it.
- Compare across targets. Model several coverage levels and compare cost, coverage, utilization, and projected savings side by side before you buy. View the output as interactive charts or pull it through the Purchase Analyzer API for a spreadsheet.
Two limits are worth remembering, both stated in the AWS analysis calculations documentation. The analyzer does not forecast future usage; it applies the modelled plan to each hour of the historical lookback only. And it generates recommendations for immediate purchases, not for future or scheduled buys. So the quality of the recommendation is only as good as the representativeness of the 60-day window you feed it.
A worked example
The numbers here are illustrative, chosen to show the mechanics rather than to quote AWS pricing. Suppose an account runs a steady-state floor of about $14.00 per hour of eligible On-Demand compute, roughly $10,000 per month. Current coverage sits at 30%, so about $7,000 of that monthly spend is still at full price.
You decide on a 75% coverage target for the always-on baseline, using a one-year no-upfront Compute Savings Plan for flexibility. In the Purchase Analyzer you set the lookback to a representative 30-day window, exclude a plan expiring in 45 days, and enter 75%. The analyzer returns the hourly commitment that covers 75% of that floor, then shows the projected utilization and savings. You model 70%, 75%, and 85% side by side, see that 85% pushes projected utilization below your comfort line because two services are mid-migration, and commit at 75%. Six weeks later you re-run the analysis and layer a second small commitment as the floor holds. That layered, target-driven approach is what the practitioner write-ups, including this comparison of AWS target coverage versus a cost-curve sizing method, describe as lower-risk than a single large purchase.
Where target coverage still leaves a judgement call
The feature removes the arithmetic, not the strategy. Three gaps remain.
First, it optimises for a coverage number, not for Effective Savings Rate. A high coverage target met with a rigid three-year plan can still produce a worse ESR than a moderate target met with flexible layering, because the rigid plan strands commitment when workloads move. Judge the result on ESR, not coverage alone.
Second, there is no forecast. Because the analyzer only replays the lookback window, a growing account will be under-covered next quarter and a shrinking one over-committed. Layering, re-running the analysis every four to six weeks, is how teams keep the target honest. The FinOps Foundation's guidance on automating AWS compute Savings Plan purchases treats this as a continuous loop, not a once-a-year event.
Third, target coverage is single-account math on your own history. It does not weigh a Graviton or Arm migration you have already scheduled, a Reserved Instance conversion, or a spot-heavy re-architecture. If you know a change is coming, model the post-change floor and set the target against that, not against last month's bill.
J.R. Storment, Executive Director of the FinOps Foundation, has put the case for disciplined, automated commitment management plainly: "The need for automated platforms like ProsperOps could not be greater as organizations streamline and maximize the business value of the cloud while supporting their FinOps teams." Target coverage is AWS bringing part of that discipline into the native console, quoted in the FinOps Foundation's announcement. It is a better default, not a full autopilot.
India-specific considerations
For Indian teams and the global capability centres that run large AWS estates from Gurugram, Bengaluru, and Hyderabad, two points matter. Many Indian customers are invoiced in rupees through AWS's local India entity, so a Savings Plans commitment is rupee-denominated and does not swing with the dollar exchange rate; the commitment risk is purely a usage question, which is exactly what target coverage models. And because a Savings Plan is an account-level financial commitment, the sizing decision usually needs finance sign-off, so the ability to model 70%, 75%, and 85% and show the cost of each is as much a governance tool as an engineering one.
Data-handling rules still apply to the billing and usage exports that feed this analysis. The Digital Personal Data Protection Act, 2023 (DPDP) governs personal data, not cost telemetry, but the same discipline of controlling who can see and act on financial data belongs in a FinOps process. eCorpIT is ISO 27001:2022 certified, and we build the access controls around cost tooling to that standard. For a broader treatment of committed-use discipline across providers, see our guide to cloud FinOps for Indian teams and the deeper AWS FinOps cost breakdown for India.
How eCorpIT can help
eCorpIT is a CMMI Level 5 and ISO 27001:2022 certified engineering organisation in Gurugram that runs cloud cost optimisation as a standing practice, not a one-off audit. Our senior-led teams size Savings Plans and Reserved Instance commitments to a coverage target, wire the analysis into a monthly layering cadence, and set the access controls so finance and engineering share one view of the commitment. If your AWS bill is running mostly at On-Demand rates, or a past over-commitment stranded budget, contact us to model your coverage targets and build the FinOps loop around them. For adjacent work, see our AWS FinOps agent and cost analysis coverage and whether AWS database Savings Plans are worth it.
FAQ
References
- AWS What's New: Savings Plans Purchase Analyzer now supports target coverage analysis (June 8, 2026)
_Last updated: July 30, 2026._