On this page · 9 sections
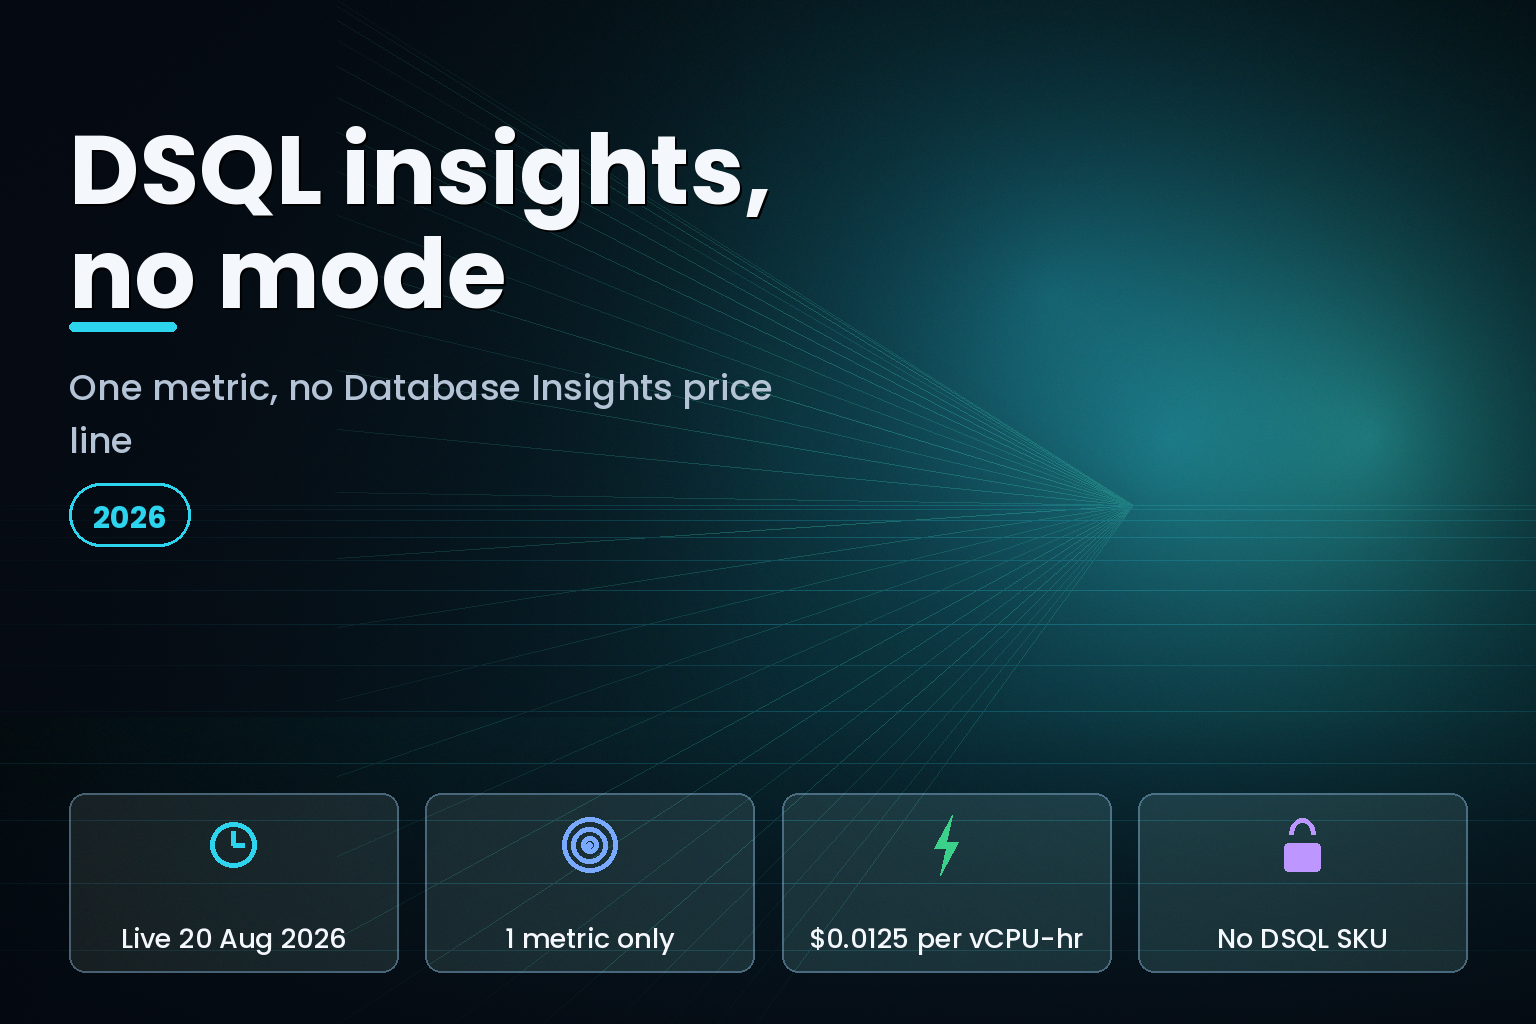
Summary. On 20 August 2026 AWS gave Amazon Aurora DSQL a CloudWatch Database Insights metric, sampled once per second and published once per minute, described as available by default at no additional cost. Three things the announcement leaves out. The CloudWatch mode model that governs retention and price applies to RDS, Aurora provisioned, Aurora Serverless and Aurora Limitless, and does not name Aurora DSQL. The AWS Price List API carries Database Insights SKUs metered in vCPU-hours at $0.0125 and ACU-hours at $0.003125, and no Aurora DSQL SKU exists, because DSQL bills in DPUs at $0.000008 per DPU in N. Virginia and $0.000009 in Mumbai. And the whole feature is one metric, db.active_sessions.avg, not the lock trees and execution plans that Advanced mode gives Aurora PostgreSQL.
That combination is worth understanding before you plan post-incident forensics on a DSQL cluster.
What shipped on 20 August 2026
The AWS What's New entry is dated 20 August 2026. It describes per-statement, cluster-level performance monitoring that captures sampled wait states and normalized SQL statements for all active cluster sessions, at a 1-minute interval, available by default at no additional cost, in every AWS Region where Aurora DSQL runs.
The Aurora DSQL user guide names the mechanism: DSQL Active Session History, abbreviated DASH. DASH samples every active session on the cluster once per second, records the wait event and the normalized SQL statement, then aggregates and publishes to CloudWatch once per minute as OpenTelemetry metrics. It is on for every cluster and there is no setup step.
The output is a single time series called db.active_sessions.avg, the Average Active Sessions figure that Oracle DBAs and Aurora PostgreSQL users will recognise. It carries three dimensions: db.wait.class, db.wait.event and db.session.state, plus the SQL breakdown. One metric, three labels. That is the whole surface.
The wait events are DSQL-specific and worth reading before an incident, because they do not map to PostgreSQL wait events: OnCpu, ClientRead, Commit, SequentialScanRead, ScatteredBatchRead, SingleRead, UniqueConstraintCheck, FkExistenceCheck and PgSleep. The guide states the list might expand.
One coverage detail matters operationally: the guide says DASH tracks only sessions that have an open transaction. A cluster can hold up to 10,000 connections, so the gap between connection count and sampled session count is a number to check before you read AAS as total cluster load.
The mode model does not include Aurora DSQL
Here is the conflict. The CloudWatch Database Insights page lists Aurora DSQL among the databases it monitors, alongside Aurora MySQL, Aurora PostgreSQL, Aurora PostgreSQL Limitless and five RDS engines. Twenty-three lines later, the same page says something narrower: Database Insights modes apply to Amazon Relational Database Service, Amazon Aurora provisioned, Amazon Aurora Serverless and Amazon Aurora Limitless databases.
Aurora DSQL is not in that second list. Modes are not cosmetic. Standard mode and Advanced mode are what decide retention, feature access and, for anything beyond 7 days, the bill.
| Capability | Standard mode | Advanced mode | Aurora DSQL |
|---|---|---|---|
| Detailed metric retention | Free to 7 days, paid 1-24 months | 1-24 months at no extra cost | Not stated, DSQL is outside the mode model |
| Analyze SQL locks with 15 months retention | Not supported | Aurora PostgreSQL and RDS for PostgreSQL only | Not available |
| Analyze SQL execution plans with 15 months retention | Not supported | Aurora PostgreSQL, RDS for Oracle, RDS for SQL Server only | Not available, use EXPLAIN ANALYZE VERBOSE |
| Operating system process metrics | Not supported | Requires RDS Enhanced Monitoring | Not applicable, DSQL is serverless |
| Fleet-wide saved monitoring views | Not supported | Supported | Not stated |
| Top contributors to DB load by dimension | Supported | Supported | Available through the DB Load chart |
The two Advanced features people actually switch modes for, lock analysis and execution plan analysis, are restricted by engine name in the CloudWatch feature table. Aurora DSQL is PostgreSQL-compatible but it is not Aurora PostgreSQL, so it is outside both restrictions. The CloudWatch documentation has a dedicated page for monitoring Aurora Limitless databases with Database Insights and no equivalent page for Aurora DSQL; it links out to the DSQL user guide instead.
The Price List API has no Aurora DSQL Database Insights SKU
The pricing side confirms the same gap, and it is checkable rather than inferred.
We pulled the AmazonCloudWatch current offer index from the AWS Price List API on 22 August 2026 and filtered every Database Insights usage type in N. Virginia (us-east-1) and Mumbai (ap-south-1).
| Database Insights usage type | Metering unit | us-east-1 | ap-south-1 |
|---|---|---|---|
| Provisioned Aurora and RDS engines | vCPU-hour | $0.0125 | $0.0125 |
| Aurora Serverless and Aurora PostgreSQL Limitless | ACU-hour | $0.003125 | $0.003125 |
| Standard mode, first month retention | vCPU-hour | $0.002054 | $0.002305 |
| Standard mode, each additional month | vCPU-hour | $0.000086 | $0.000096 |
| Standard mode, first month retention | ACU-hour | $0.000513 | $0.000576 |
| Database Insights API calls | API call | $0.00001 | $0.00001 |
| Aurora DSQL | none published | no SKU | no SKU |
Every Database Insights meter is denominated in vCPU-hours or ACU-hours. Aurora DSQL has neither. Per the Aurora DSQL billing guide, DSQL meters database activity in Distributed Processing Units, split into Compute DPU, Read DPU and Write DPU, with a Stream DPU component when change data capture is on and a MultiRegion Write DPU component on multi-Region clusters. Storage is metered in GiB-month. The bill shows two line items: storage and DPU.
From the AuroraDSQL current offer index, retrieved 22 August 2026, DPUs cost $0.000008 in N. Virginia and $0.000009 in Mumbai, which is $8.00 and $9.00 per million DPUs. Storage is $0.33 per GB-month in N. Virginia and $0.36 in Mumbai. Mumbai carries a 12.5 percent premium on DPUs and 9.1 percent on storage.
So "no additional cost" is accurate, and it is accurate partly because there is no unit to bill against. The consequence is the part to plan around: there is no published path to buy extended retention of DSQL wait-state history the way you can buy 24 months of it for an Aurora PostgreSQL cluster at $0.000086 per vCPU-hour per additional month.
What this changes in practice
If your incident review process depends on pulling a lock tree or a stored execution plan from 3 months ago, that process does not exist on Aurora DSQL today. The substitutes are different tools.
For per-query cost, use EXPLAIN ANALYZE VERBOSE. The DPU documentation confirms Aurora DSQL emits statement-level DPU figures in that plan output, broken into ComputeDPU, ReadDPU, WriteDPU and MultiRegionWriteDPU. That is the closest thing DSQL has to per-query cost attribution, and it runs at development time rather than after an incident.
For programmatic access to load data, use PromQL against the CloudWatch OpenTelemetry metric in Query Studio. Because the metric name contains dots, queries need the quoted-name selector form, {"db.active_sessions.avg"}, and a @resource.aws.auroradsql.cluster_id label filter to scope to one cluster. Teams that script their dashboards should note that syntax now rather than discover it at 2am.
For load interpretation, drop the old rule of thumb. On a provisioned database, AAS above the vCPU count means the instance is saturated. The DSQL guide says that comparison does not hold, because DSQL scales CPU elastically, and directs you to read the proportional shape of the wait profile against your own baseline instead. If nobody has captured that baseline, capture it now, while the cluster is healthy.
India-specific considerations
Mumbai (ap-south-1) pays more for the database and the same for the monitoring. DPUs are $0.000009 against $0.000008 in N. Virginia, and storage $0.36 against $0.33 per GB-month, while the Database Insights vCPU-hour and ACU-hour rates are identical in both Regions. For an Indian team weighing Aurora DSQL against Aurora Serverless v2 for a domestic workload, that is a real input alongside our Aurora DSQL versus Serverless v2 cost comparison.
The retention gap has a compliance edge too. Teams operating under DPDP (Digital Personal Data Protection Act 2023) obligations often set an internal window for retaining diagnostic evidence after a data incident. On Aurora PostgreSQL you can pay for 24 months of per-query metric retention. On Aurora DSQL there is no published equivalent, so the evidence window has to come from your own export of the CloudWatch metric rather than from a Database Insights retention setting. Decide who owns that export before you need it.
What is still unknown
AWS has not stated a retention period for DSQL DASH data, has not placed Aurora DSQL in either Database Insights mode, and has not published a Database Insights price for DSQL. Whether Advanced mode will ever apply to a serverless engine with no vCPU or ACU unit is also unstated. Until AWS updates the mode paragraph or adds a SKU, treat DSQL Database Insights as a live dashboard rather than a forensic archive.
FAQ
How eCorpIT can help
eCorpIT is a CMMI Level 5 and ISO 27001:2022 certified engineering organisation in Gurugram, and our senior-led teams build the observability layer that sits around managed AWS databases rather than assuming the console covers it. For Aurora DSQL that means capturing a wait-profile baseline, exporting DASH metrics on a schedule so incident evidence outlives the dashboard, and wiring DPU figures from EXPLAIN ANALYZE into cost review. If DSQL is on your roadmap, book a database observability review with our DevOps engineering practice.
Further reading on this pillar: cloud FinOps for Indian teams and cloud cost optimization for Indian companies.
References
Last updated: 22 August 2026.