On this page · 11 sections
- What CloudWatch Coding Agent Insights actually does
- Why engineering leaders needed this
- The five sections of the dashboard
- Setup: from bearer token to live dashboard
- The queries and alerts that matter
- What it costs to run
- Coding Agent Insights versus rolling your own
- India-specific considerations
- FAQ
- How eCorpIT can help
- References
Summary. On July 20, 2026, Amazon Web Services launched CloudWatch Coding Agent Insights, a dashboard that shows engineering leaders how AI coding tools are used and what they return. It reads OpenTelemetry metrics from Claude Code, OpenAI Codex and GitHub Copilot and presents token spend, per-team cost and developer-productivity signals next to existing CloudWatch data. Claude Code connects through the Claude apps gateway for AWS with no extra instrumentation. The economics are small: in AWS's own worked example, tracking 200 developers costs about $0.14 a month in metric ingestion at $0.50 per GB, stays under $14 a month even at 100 times the volume, and totals under $15 a month, while PromQL queries in the console are free and metrics are kept for up to 15 months. The feature builds on CloudWatch OpenTelemetry Protocol (OTLP) ingestion, which reached general availability in June 2026. It is available in every AWS commercial region except Middle East (UAE), Middle East (Bahrain) and Israel (Tel Aviv). This guide covers what it measures, how to wire it up, the queries and alerts that matter, and where the numbers stop and judgement starts.
As AWS observability specialist Rodrigue Koffi and colleagues put it on the AWS Cloud Operations Blog, for an organisation running agents like Claude Code, "usage is likely growing faster than your ability to track it." Token consumption, cost per team and developer output are questions most dashboards cannot answer, because the telemetry never reached the observability backend. Coding Agent Insights closes that gap by treating coding-agent metrics as first-class operational data.
What CloudWatch Coding Agent Insights actually does
Coding Agent Insights is a purpose-built view inside Amazon CloudWatch. The metrics arrive over OpenTelemetry, the same protocol teams already use for application observability, so the data lands beside service metrics rather than in a separate tool. For Claude Code the path is shortest: the Claude apps gateway for AWS emits telemetry directly, with no agent instrumentation to add. OpenAI Codex and GitHub Copilot are supported through the same OpenTelemetry pipeline.
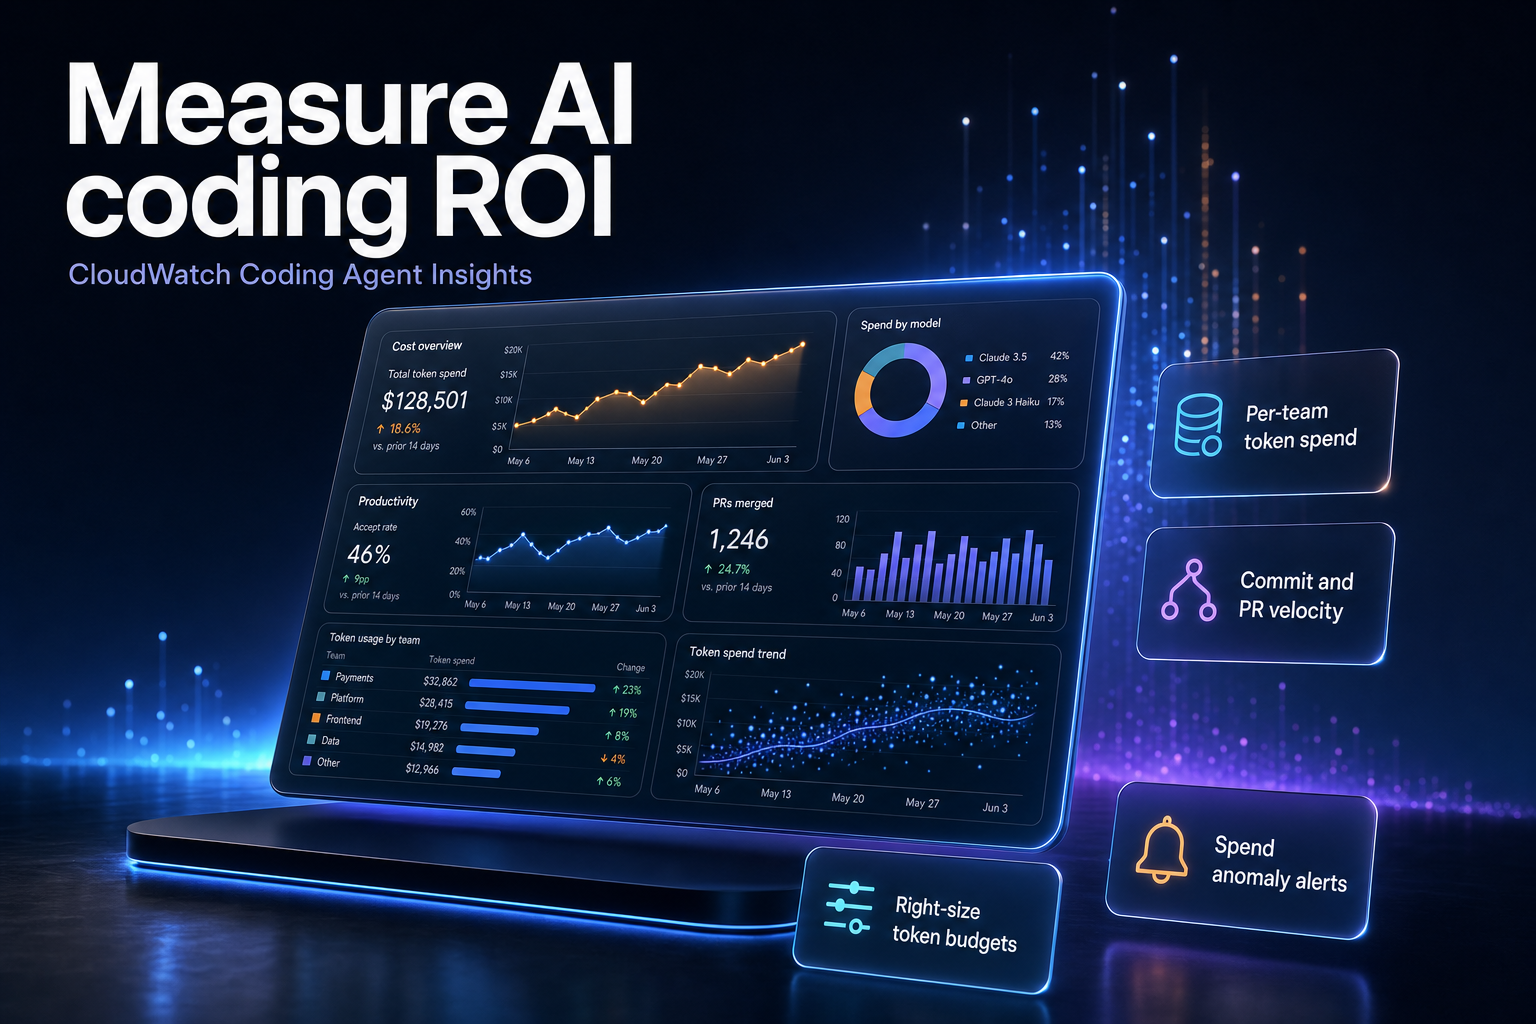
The stated purpose is return on investment. As organisations scale agent adoption, they need to answer which teams would benefit from expanded access, where agents are accelerating delivery, and how to right-size token budgets across departments. The dashboard lets a leader track spend trends, set proactive token-billing alerts, correlate adoption with commit throughput and pull-request velocity, and identify which models give the best cost-to-output ratio for a given workload. That last point matters in 2026, when a team might route work across several models and needs evidence, not opinion, about which one earns its keep.
Why engineering leaders needed this
The measurement gap is real and it is recent. AI coding agents went from experiment to daily tool inside most engineering organisations over 2025 and 2026, and finance noticed the bill before engineering could explain it. The core problem is attribution: a per-seat licence tells you nothing about who is actually getting value, and raw token spend on a vendor invoice does not map to teams, services or outcomes.
Coding Agent Insights answers three questions that recur in every AI-tooling budget review. Who is consuming the tokens, and is that consumption concentrated in a few power users or spread across the team? Where is the spend translating into shipped work, measured through commits and merged pull requests rather than raw activity? And which model, at which effort level, delivers acceptable output for the lowest cost? Those are the same questions that make AI agent evaluation in CI/CD hard, and the answer is the same: you cannot manage what you do not instrument. Coding Agent Insights extends the OpenTelemetry GenAI conventions for LLM and agent tracing from tracing into cost and productivity reporting.
The five sections of the dashboard
AWS ships a pre-built dashboard, organised into five sections that move from a high-level summary down into detail. The structure is worth understanding before you build alerts on top of it.
| Section | Question it answers | Example panels |
|---|---|---|
| Overview | Are we healthy at a glance? | Total tokens used, active users, sessions, cache hit rate |
| Token usage | How much are we consuming, and where? | Spend over time, tokens by type, usage by model, top users, estimated cost per user |
| Developer productivity | What are developers producing? | Lines added and removed, commits, active coding hours, pull requests, code edit accept/reject rate |
| Organizational breakdown | Who owns the cost? | Token usage by department and by team, for chargeback |
| Amazon Bedrock API health | Is the backend behaving? | Throttle events, client errors, server errors by model |
The token-usage section answers what AWS calls the first question engineering leaders ask: how much are we consuming, and where is it going. It splits consumption by type (input, output, cache read, cache creation), by model, by user and by estimated cost, which is how you find the model driving spend and the handful of users driving volume.
The developer-productivity section is the one to read carefully. It tracks lines of code added and removed, commits, active coding hours, pull requests created, and the accept-versus-reject rate on the agent's suggested edits, plus a language breakdown of where AI assistance concentrates. These are activity signals. Lines of code and commit counts are inputs, not shipped value, and a mature review treats the accept/reject rate as a measure of how well suggestions match intent rather than a productivity score. Used honestly, the section shows adoption and friction; used naively, it rewards volume.
Setup: from bearer token to live dashboard
The setup rests on CloudWatch OTLP metrics ingestion, which reached general availability in June 2026 with bearer-token authentication. That is the change that makes this practical: tools running on developer laptops, outside AWS, can ship metrics with a single authorization header, with no collectors, no sidecars and no IAM credential wiring on each machine.
Start by creating a CloudWatch metrics API key. In the CloudWatch console, open Settings under Setup, find API Keys, and choose Create. CloudWatch creates an IAM user on your behalf, scoped to the CloudWatchAPIKeyAccess managed policy. The same thing can be done from the CLI:
            aws iam create-user --user-name cloudwatch-metrics-api-key-user
aws iam attach-user-policy \
    --user-name cloudwatch-metrics-api-key-user \
    --policy-arn arn:aws:iam::aws:policy/CloudWatchAPIKeyAccess
aws iam create-service-specific-credential \
    --user-name cloudwatch-metrics-api-key-user \
    --service-name cloudwatch.amazonaws.com
The response carries the bearer token in the ServiceCredentialSecret field. Store it in AWS Secrets Manager or your vault, never in version control, and rotate it with a scheduled job. Bearer tokens are long-term credentials, so for workloads that run inside AWS, where short-lived SigV4 credentials are feasible, prefer those instead. The OTLP endpoint requires HTTPS and rejects plain HTTP.
With the token stored, configure Claude Code to export metrics. The resource attributes are the important part: they become the labels you group and filter by in every dashboard and alarm.
            export CLAUDE_CODE_ENABLE_TELEMETRY=1
export OTEL_METRICS_EXPORTER=otlp
export OTEL_EXPORTER_OTLP_PROTOCOL=http/json
export OTEL_EXPORTER_OTLP_ENDPOINT="https://monitoring.<AWS_REGION>.amazonaws.com"
export OTEL_RESOURCE_ATTRIBUTES="user.id=$(whoami),team.id=${TEAM:-engineering},cost_center=${COST_CENTER:-default},department=${DEPARTMENT:-engineering},environment=${ENV:-dev}"
export OTEL_EXPORTER_OTLP_HEADERS="Authorization=Bearer ${BEARER_TOKEN}"
Run a short session, then open CloudWatch Query Studio and type claude_ to confirm metrics such as claude_code.token.usage are flowing. Deploy the pre-built dashboard from the AWS observability accelerator repository with aws cloudwatch put-dashboard, and the panels populate automatically as long as your resource attributes are consistent across the fleet.
One decision to make early is token granularity. AWS describes three approaches: a token per developer, a token per team, or one organisation-wide token with identity carried in client-side resource attributes. All three produce identical dashboards, because attribution is driven by attributes, not the token. Start with a single shared token to validate the pipeline, then move to per-developer tokens when compliance requires credentials traceable to a named individual or when clean offboarding, revoking one IAM user, is a hard requirement.
The queries and alerts that matter
Every panel is backed by a PromQL query, and any query can become a CloudWatch alarm. Three alert patterns from the AWS guidance cover most of what a leader needs on day one.
The first catches a runaway agent or a compromised token: alert when a user spends more in one hour than twice their entire previous day.
            sum by("user.email") (increase({"claude_code.cost.usage"}[1h]))
> 2 * sum by("user.email") (increase({"claude_code.cost.usage"}[24h]))
The second is a simple team budget guardrail, here set at a daily threshold:
sum by ("team.id") (increase({"claude_code.cost.usage"}[24h])) > 500
The third is an adoption-regression signal that fires when a team's daily sessions fall below half its seven-day average, which usually means a tooling or access problem rather than a change in behaviour:
            sum by ("team.id") (increase({"claude_code.session.count"}[1d]))
< 0.5 * avg_over_time(sum by ("team.id") (increase({"claude_code.session.count"}[1d]))[7d:1d])
The spend alerts belong in the same budget conversation as the rest of your API spend, and they pair naturally with an LLM hybrid-routing and API-spend decision framework so that a spike triggers a routing review, not just an email.
What it costs to run
The instinct is that fine-grained telemetry on hundreds of developers must be expensive. It is not. AWS published the arithmetic for a 200-developer organisation, and the numbers are worth keeping because they defuse the usual objection in a budget meeting.
| Input | Value |
|---|---|
| Developers | 200 |
| Sessions per developer per day | 20 |
| Metric data points per session | 7 |
| Bytes per data point (10 to 15 attributes) | ~450 |
| Daily volume | 12.6 MB |
| Monthly volume (22 working days) | ~0.27 GB |
| Ingestion price | $0.50 per GB |
| Base monthly cost | ~$0.14 |
| Cost at 100x volume (high-cardinality) | under $14 |
| Total for 200 developers | under $15 per month |
PromQL queries in the CloudWatch console are free, and CloudWatch retains metrics for up to 15 months at no extra charge. The cost of measurement is a rounding error against a single AI-coding seat, which removes the last reason not to instrument. The real budget conversation is about the token spend the dashboard reveals, not the cost of the dashboard.
Coding Agent Insights versus rolling your own
Many teams already run OpenTelemetry and could build this by hand. The question is whether that is worth it. The comparison below weighs the managed feature against a do-it-yourself collector-and-Grafana stack and a third-party AI-observability SaaS.
| Vector | CloudWatch Coding Agent Insights | DIY OTel collector + Grafana | Third-party SaaS |
|---|---|---|---|
| Time to first dashboard | Minutes; pre-built dashboard | Days to weeks | Hours to days |
| Per-developer cost attribution | Built in via resource attributes | You design the schema | Usually built in |
| Token and adoption alerting | PromQL alarms from any panel | You write and maintain | Vendor-defined |
| Productivity metrics | Included (commits, PRs, edits) | You model them | Varies by vendor |
| Data residency and control | Your AWS account and Region | Your infrastructure | Vendor-hosted |
| Incremental cost | Under $15/month at 200 devs | Collector and Grafana run cost | Per-seat or per-event pricing |
If your engineering estate already lives in AWS, the managed path wins on time-to-value and keeps developer telemetry inside your own account and Region. A DIY stack makes sense only when you need attribution or retention that the managed dashboard does not offer, and a third-party tool earns its place when you want cross-vendor coverage beyond coding agents. This is the same build-versus-buy calculus that governs free tooling for measuring LLM costs, and it sits inside the broader programme of running enterprise AI agents in production.
India-specific considerations
For India's global capability centres and product teams, the appeal is chargeback. A GCC running engineering for a parent company needs to attribute AI-coding spend to the right cost centre and department, and the cost_center and department resource attributes map directly to that need. The same per-team view supports the internal-billing conversations that decide whether a tool gets expanded across a 500-person centre or held to a pilot.
There is a data-handling dimension too. Developer telemetry includes identifiers such as email and user ID, which are personal data under the Digital Personal Data Protection (DPDP) Act 2023. Keeping that telemetry inside your own AWS account and Region, rather than a third-party tool, simplifies the reasonable-security-safeguards question, and per-developer tokens give clean revocation when someone leaves. Teams building this into a wider cost programme can align it with a cloud FinOps approach for Indian teams so AI-coding spend is governed the same way as the rest of the cloud bill.
FAQ
How eCorpIT can help
eCorpIT helps engineering organisations put AI coding agents into production and prove their value, not just adopt them. Our senior engineering teams wire OpenTelemetry data from Claude Code, Codex or Copilot into CloudWatch or Grafana, define the resource attributes that make per-team chargeback work, and set the spend and adoption alerts that keep budgets predictable. For teams under the DPDP Act 2023, we design developer-telemetry pipelines aligned with its data-handling expectations, backed by our ISO 27001:2022 and CMMI Level 5 practices. To measure the return on your AI coding spend, talk to our engineering team.
References
- AWS, "Amazon CloudWatch announces coding agent insights" (July 20, 2026).
- AWS Cloud Operations Blog, "Analyzing Claude Code usage with CloudWatch and OpenTelemetry" (June 17, 2026).
- AWS Observability best practices, "Coding agents observability".
- Claude Code, "Monitoring usage: available metrics and events".
_Last updated: 27 July 2026._