On this page · 12 sections
- Why LLDB needs better Swift concurrency support
- The new Swift task tree command
- Why a task tree is useful
- LLDB now ships with an MCP server
- lldb-mcp is not Xcode's MCP server
- What this means for AI-assisted debugging
- Instruments for the timeline view
- A faster first po with bridging headers
- What developers should not assume
- Checklist for a hard Swift concurrency bug
- How eCorpIT can help
- References
Summary. Xcode 27 adds three LLDB features for Swift developers.
- A
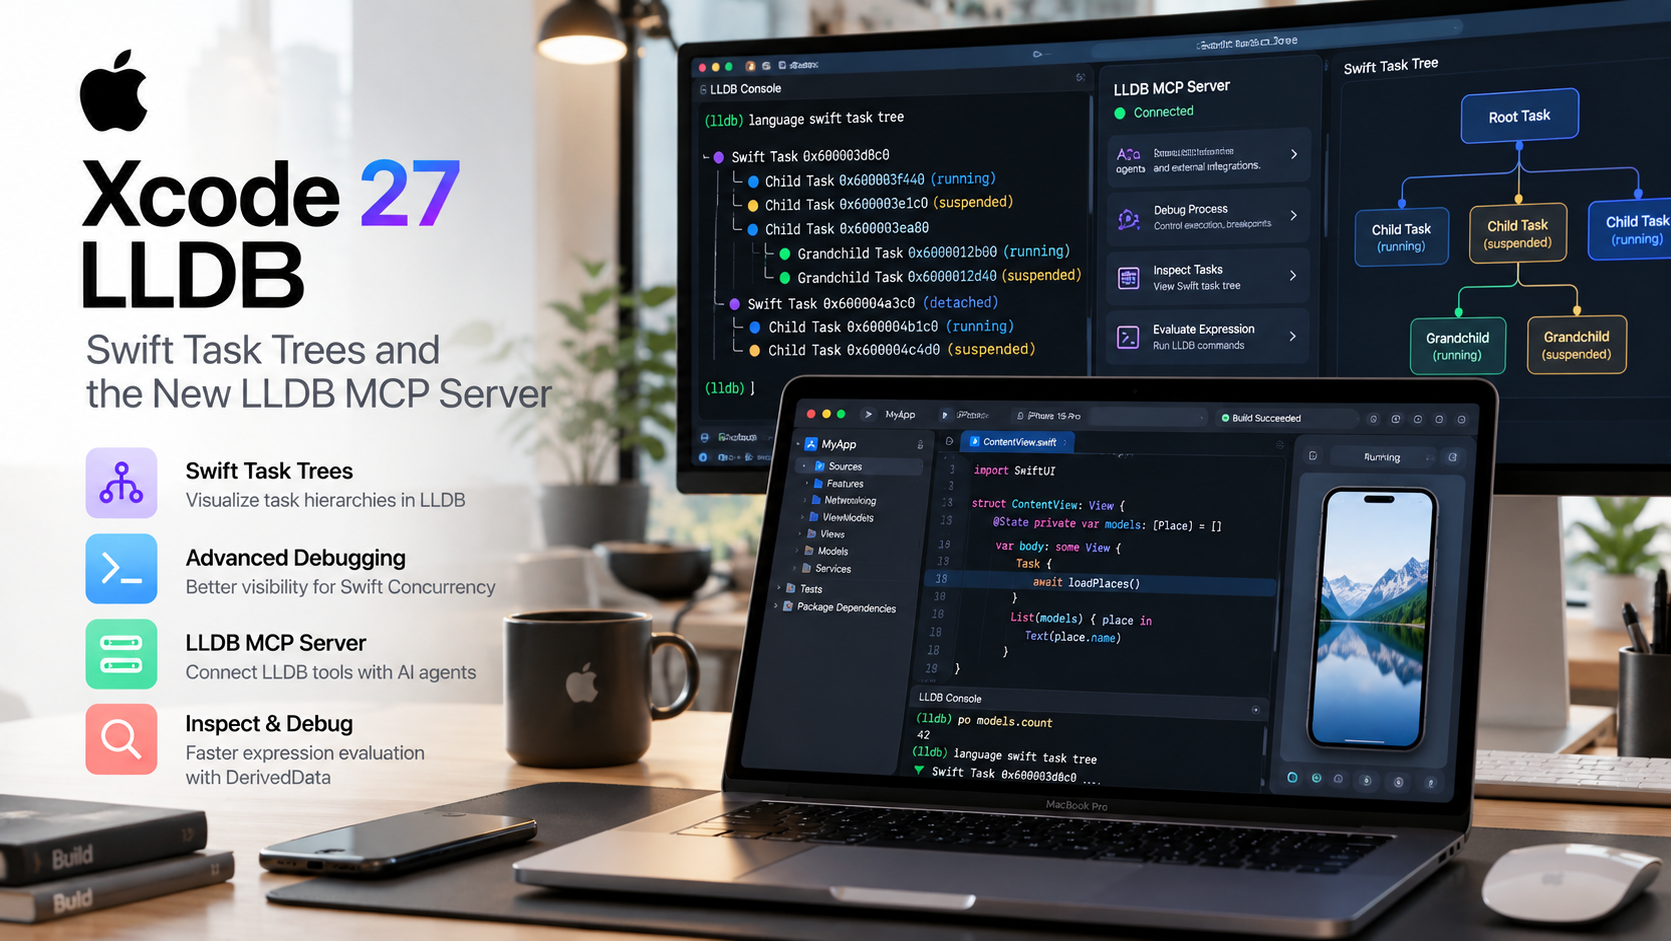
language swift task treecommand prints the Swift tasks the debugger knows about as a tree.
- LLDB now ships an MCP server,
lldb-mcp, that AI agents can call.
- Projects with a bridging header get a much faster first
po.
We checked them on Xcode 27.1, and each comes with a catch:
- The task tree can miss idle tasks created with
Task {}orTask.detached.
lldb-mcpexposes a single tool that runs any LLDB command, so only the agent's own permission settings stop risky ones.
- Apple's linked documentation describes a newer
lldb-mcpthan the one Xcode ships.
Swift concurrency changed how iOS developers structure asynchronous code. Async functions, tasks, actors, task groups and executors make apps easier to reason about in source, but they can make runtime debugging harder. When a breakpoint stops inside async code, a thread-centric debugger view leaves questions open: which task is running, where it came from, which other tasks exist and how they relate.
About this article. This guide is based on Apple's Xcode 27 release notes, LLDB's own documentation and source for the Swift 6.4 toolchain, Swift.org and Apple's Instruments material, and on commands we ran against the LLDB in Xcode 27.1 (lldb-2103.0.34.103), as checked on 17 October 2026. Researched with AI assistance and reviewed by our editorial team.
Why LLDB needs better Swift concurrency support
Traditional debugging starts from threads: a process with thread 1, thread 2 and thread 3, each with a stack. That model still matters, but Swift concurrency adds a higher level. Tasks suspend and resume on a shared pool of threads, so the thread a task ran on a moment ago tells you little about the task itself.
            func loadDashboard() async {
    async let profile = fetchProfile()
    async let notifications = fetchNotifications()

    let result = await (profile, notifications)
    updateUI(result)
}
In source, this is two child tasks and a wait. At runtime, the debugger has to reconstruct those task relationships from the state of the process. That matters most when you debug nested tasks, task groups, detached tasks, actor code, cancellation, suspended work, unexpected task creation and concurrency-related hangs.
The new Swift task tree command
Apple's release notes describe the new command as printing a tree of all the Swift tasks the debugger knows about. On Xcode 27.1 its full syntax is:
language swift task tree [--max-frames <count>]
The option, short form -f, sets how many stack frames appear under each task. LLDB's source sets the default to eight. Run the command while the process is paused, and use help language swift task tree for the built-in help.
What the output looks like
There is no single root. The command prints a forest: one tree for each top-level task it finds, ordered by task ID. Each line names a task with its ID, its name if it has one and its address, plus state flags such as running, enqueued, suspended or awaiting another task. A few stack frames are listed under each task.
Which tasks it finds
The help text in Xcode 27.1 is precise about this. The command starts from tasks running on a thread. It adds their parents and children, and the tasks waiting on any of those, and repeats until it finds nothing new.
It also states the limit plainly: it fails to discover some tasks created through unstructured concurrency. A task with no parent, created with Task {} or Task.detached, is missed when three things are all true:
- neither it nor any of its descendants is running on a thread;
- neither it nor any of its descendants is waiting on a task already found;
- as a result, none of its descendants is found either.
Completed tasks never appear. So the tree is not a history of every task, and it is not even a complete list of live tasks. An idle detached task, which is exactly the kind behind many unexpected-task bugs, can be missing. Upstream LLDB has since moved to reading the Swift runtime's own task registry to close this gap. That change is not in the Swift 6.4 toolchain Xcode 27 ships.
The rest of the task commands
The tree is one member of a family. In Xcode 27's LLDB, language swift task has five subcommands: backtrace, select, info, list and tree. list and tree are the new ones.
language swift task listlists every discovered task.
language swift task info <address>prints details of one task, including whether it is cancelled, whether it is a task group child and whether it came fromasync let.
language swift task selectmoves you to a task's thread.
Use info for cancellation questions: the tree does not show cancellation, but the task's details do.
Why a task tree is useful
Consider an app that loads several things at once:
            await withTaskGroup(of: Void.self) { group in
    group.addTask { await loadProfile() }
    group.addTask { await loadOrders() }
    group.addTask { await loadRecommendations() }
}
When something goes wrong, the usual loop is to stop at a breakpoint, inspect the thread, read the backtrace, inspect variables and continue. The task tree adds the question the thread view cannot answer: which task is this, what created it and what is it waiting for.
A practical sequence:
- Pause at the failing behaviour.
- Run
language swift task treeto see the task structure.
- Pick the relevant task and run
language swift task infowith its address.
- Use
language swift task selectand normal LLDB commands to inspect its frames and variables.
- Continue and reproduce.
The command does not replace breakpoints, backtraces, logging or Instruments. It adds a task-level view to them.
LLDB now ships with an MCP server
The second change: LLDB in Xcode 27 ships with an MCP server, lldb-mcp. The Model Context Protocol is an open standard for connecting AI applications to tools. lldb-mcp lets an AI agent drive the debugger directly instead of relying on output a developer copies by hand.
lldb-mcp is a program an MCP client launches, not a command you type in LLDB. It lives in Xcode's developer tools and you can call it as xcrun lldb-mcp. When it starts, it looks for an LLDB that has registered an MCP server. If it finds none, it starts a headless LLDB of its own and connects to that. If it finds more than one, it stops with an error, because choosing between them is not implemented yet. In our test, the headless LLDB it started kept running after the client disconnected, so check for leftover lldb processes after a session.
What Xcode 27's lldb-mcp can do
We asked the lldb-mcp in Xcode 27.1 for its tools. It returned two:
command, which runs an LLDB command and can target a specific debugger;
debugger_list, which lists the debugger instances.
It also exposes each debugger and its targets as resources.
The command tool runs any LLDB command string. In the Swift 6.4 source, a note marks blocking certain commands as still to do. So an agent connected to lldb-mcp can evaluate expressions, write memory or kill the process. The only limits are the ones your MCP client applies, so review the agent's tool permissions before you connect it to a session that matters.
Mind the documentation gap
Apple's release note links to LLDB's upstream MCP page for examples. That page has since been rewritten for a newer lldb-mcp with four session-based tools. Xcode 27's build has the older two-tool interface. The Swift 6.4 branch's own copy of the documentation describes an even older single tool. Treat the upstream examples as a guide to the idea, and check the tools your installed version reports.
Connecting an agent
For a client that launches MCP servers over standard input and output, the upstream documentation's pattern adapts to Xcode like this for Claude Code:
claude mcp add lldb --transport stdio -- xcrun lldb-mcp
We confirmed that xcrun lldb-mcp answers MCP initialisation and tool-list requests in Xcode 27.1. We did not test every client. To expose an LLDB session you already have open in a terminal, LLDB's protocol-server start MCP command starts a server in that session, and protocol-server stop MCP stops it.
lldb-mcp is not Xcode's MCP server
Xcode has its own MCP server, a separate program reached through xcrun mcpbridge. It arrived in Xcode 26.3, not Xcode 27. Xcode 27 adds new tools to it for debugging projects through the active run state and the debugger console, and for working with schemes, run destinations, build settings, compiler flags, entitlements and Info.plist keys.
| Xcode MCP server | LLDB MCP server | |
|---|---|---|
| Program | xcrun mcpbridge |
xcrun lldb-mcp |
| Since | Xcode 26.3 | Xcode 27 |
| Scope | The IDE: builds, tests, schemes, settings, debugger console | One or more LLDB debugger sessions |
| Tools | Many Xcode-specific tools | Run an LLDB command; list debuggers |
| Typical use | An agent working on your project | An agent investigating a live process |
They can sit in the same agent workflow, but they are different servers with different reach. Our guide to Xcode 27 coding agents covers the Xcode side, and our Xcode 27 agent security guide covers the permission settings that apply to it.
What this means for AI-assisted debugging
In a conventional AI workflow, the developer reproduces a bug, copies debugger output into a chat, gets a suggestion, applies it and repeats. With MCP, an agent can gather that evidence itself: run the app through Xcode's tools, stop it, read the task tree through lldb-mcp and inspect variables. The gain is not just automation. It is direct access to runtime context, which narrows the gap between what the code says and what the app is doing.
The agent's conclusions still need checking. Runtime evidence should drive the diagnosis, and the developer stays responsible for the fix.
Instruments for the timeline view
LLDB answers what is happening at this moment. Instruments answers how concurrency behaved over time, and Xcode 27 improves it too.
- Swift Executors instrument. It shows the cooperative pool, the main actor and custom executors. Executor names appear fully only on the 27-series operating systems.
- Task Collections. Swift task tracks now appear in Swift Task Collection tracks, which group tasks by name or place of creation.
- Profile detail view. It shows a call tree of samples taken while a task was running, and appears only when you record the Swift Concurrency instrument together with Time Profiler or CPU Profiler.
- Waiting tasks. In the actor and executor queue plot, selecting an interval lists the tasks waiting in it.
Apple's WWDC26 session on improving app responsiveness with Instruments walks through the executor tooling. Use both tools: LLDB for point-in-time inspection, Instruments for the timeline.
A faster first po with bridging headers
Xcode 27 also speeds up expression evaluation in one common case. In projects that use a bridging header, LLDB can now import explicitly built Swift modules and precompiled headers directly from DerivedData. Apple says this can dramatically speed up the first expression or po in a debug session involving a bridging header.
Swift.org's write-up on module tracking explains why. Up to Swift 6.3, LLDB always compiled a bridging header from source, which made the first expression slow. Complex expressions still need the binary modules at their original or remapped location, which holds when you debug an app you just built on the same Mac. The improvement is for that first evaluation in bridging-header projects, not a general speed-up.
The same release lets LLDB inspect types with ~Copyable fields in system frameworks.
What developers should not assume
- The task tree is not complete. It misses completed tasks and can miss idle unstructured tasks, including detached ones.
- MCP access is not limited by LLDB.
lldb-mcp's command tool runs anything; restrictions come only from the MCP client.
- The upstream docs are not Xcode's version. Check the tools your
lldb-mcpreports.
- lldb-mcp is not Xcode's MCP server. They are separate programs with different scope.
- Instruments still has its own job. LLDB inspects a moment; Instruments shows the timeline.
Checklist for a hard Swift concurrency bug
- Reproduce the issue reliably and pause at the right point.
- Run
language swift task tree, raising--max-framesif you need deeper stacks.
- Use
language swift task infoon the relevant task, including for cancellation.
- Remember the tree can miss idle detached tasks; check with logging if one seems absent.
- Record the Swift Concurrency instrument with Time Profiler for timeline detail.
- Use the Swift Executors instrument when executor behaviour matters.
- If an agent will use
lldb-mcp, review its tool permissions first.
- Validate any agent's conclusion against runtime evidence before you change code.
How eCorpIT can help
eCorpIT is a Gurugram-based technology organisation, founded in 2021, assessed at CMMI Level 5 and MSME certified, with senior-led engineering teams working across AWS, Microsoft and Google platforms. Our iOS teams debug Swift concurrency problems in production apps, from task leaks and actor contention to hangs, and set up agent-assisted debugging with sensible permissions. Talk to us at /contact-us/.
Last updated: 17 October 2026.